
An IoT Grafana InfluxDB dashboard is the professional way to visualise data from your ESP32 sensor nodes on your local network. Instead of sending data to cloud platforms that may have privacy concerns or API limits, this stack stores everything on your own server — whether that is a Raspberry Pi, an old laptop, or a mini-PC running 24/7 — and gives you beautiful, real-time graphs accessible from any device on your home network.
System Architecture Overview
The classic local IoT monitoring stack uses four components working together:
- ESP32 sensor nodes — read temperature, humidity, pressure, or any other data and publish it over Wi-Fi
- MQTT broker (Mosquitto) — a lightweight message broker that receives data from the ESP32 nodes and makes it available to subscribers
- InfluxDB — a time-series database purpose-built for storing sensor measurements efficiently. Every reading is tagged with a timestamp, making it trivial to query “temperature over the last 7 days”
- Grafana — an open-source analytics platform with a rich dashboard editor. Connect it to InfluxDB and build beautiful graphs, gauges, and heatmaps
The data flow looks like this: ESP32 → MQTT Broker → Telegraf → InfluxDB → Grafana
This architecture is extremely popular in India’s maker community because every component is free and open-source, and the entire stack runs comfortably on a Raspberry Pi 4 with 4GB RAM, or even on a Raspberry Pi 3B+ if you reduce Grafana’s memory usage.
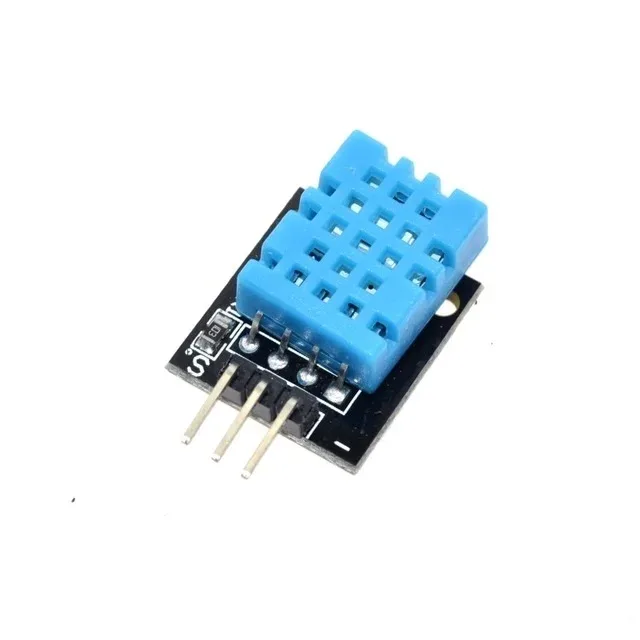
DHT11 Digital Relative Humidity and Temperature Sensor Module
The most popular entry-level sensor for ESP32 IoT dashboards in India — reads both temperature and humidity with a single data wire, perfect for Grafana monitoring.
Installing InfluxDB on Your Server
We recommend InfluxDB v2.x as it has a much improved UI and native Flux query language. Install it on Ubuntu/Debian (the most common server OS for Indian home setups):
# Add InfluxDB repo
curl -s https://repos.influxdata.com/influxdata-archive_compat.key
  | gpg --dearmor | sudo tee /etc/apt/trusted.gpg.d/influxdata-archive_compat.gpg > /dev/null
echo 'deb [signed-by=/etc/apt/trusted.gpg.d/influxdata-archive_compat.gpg] https://repos.influxdata.com/debian stable main'
  | sudo tee /etc/apt/sources.list.d/influxdata.list

sudo apt update && sudo apt install influxdb2 -y
sudo systemctl enable --now influxdb
Once installed, open http://[your-server-ip]:8086 in your browser. You will be taken through the initial setup wizard to create your first organisation, user account, and bucket. A bucket in InfluxDB is equivalent to a database — create one called iot_sensors with a retention period of 30 days to start with.
Generate an API token during setup — you will need this token for Telegraf and Grafana to authenticate with InfluxDB.
Installing Grafana on Your Server
sudo apt install -y apt-transport-https software-properties-common
wget -q -O - https://packages.grafana.com/gpg.key | sudo apt-key add -
echo "deb https://packages.grafana.com/oss/deb stable main" | sudo tee /etc/apt/sources.list.d/grafana.list
sudo apt update && sudo apt install grafana -y
sudo systemctl enable --now grafana-server
Grafana runs on port 3000 by default. Open http://[server-ip]:3000 and log in with admin/admin (change the password when prompted).
Adding InfluxDB as a data source in Grafana:
- Go to Connections → Data Sources → Add data source
- Select InfluxDB
- Set Query Language to Flux
- Set URL to
http://localhost:8086 - Under InfluxDB Details, enter your organisation, default bucket (
iot_sensors), and API token - Click Save and Test
Wiring and Programming ESP32 Sensors
You can use any sensor with your ESP32. The most popular choices for Indian home monitoring dashboards are:
- DHT11 / DHT22 — temperature and humidity (indoor climate monitoring)
- BME280 — temperature, humidity, and barometric pressure (weather station)
- DS18B20 — waterproof temperature probe (water tank temperature, outdoor use)
- PIR sensor — motion detection events
Here is a minimal Arduino sketch that reads a DHT11 and publishes the data to MQTT:
#include <WiFi.h>
#include <PubSubClient.h>
#include <DHT.h>

#define DHTPIN 4
#define DHTTYPE DHT11

const char* ssid = "YOUR_SSID";
const char* password = "YOUR_PASS";
const char* mqtt_server = "192.168.1.100"; // Your server IP
const char* topic_temp = "home/livingroom/temperature";
const char* topic_hum  = "home/livingroom/humidity";

WiFiClient espClient;
PubSubClient client(espClient);
DHT dht(DHTPIN, DHTTYPE);

void setup() {
    Serial.begin(115200);
    WiFi.begin(ssid, password);
    while (WiFi.status() != WL_CONNECTED) delay(500);
    client.setServer(mqtt_server, 1883);
    dht.begin();
}

void loop() {
    if (!client.connected()) {
        client.connect("ESP32_LivingRoom");
    }
    float temp = dht.readTemperature();
    float hum  = dht.readHumidity();
    if (!isnan(temp)) client.publish(topic_temp, String(temp).c_str());
    if (!isnan(hum))  client.publish(topic_hum,  String(hum).c_str());
    delay(30000); // Read every 30 seconds
}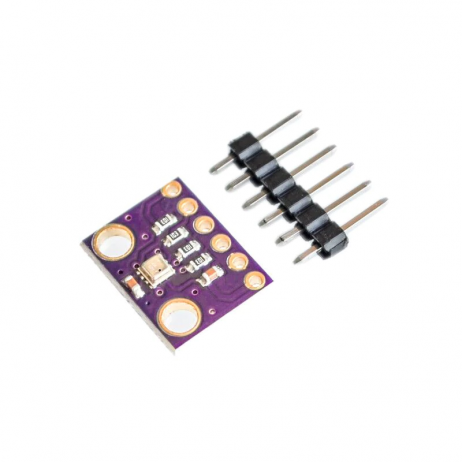
GY-BME280-3.3 Precision Altimeter Atmospheric Pressure Sensor Module
The BME280 measures temperature, humidity, AND barometric pressure over I2C — ideal for a home weather station dashboard in Grafana with three metrics per sensor.
Using MQTT and Telegraf as the Bridge
Telegraf is InfluxData’s data collection agent. It acts as the bridge between your MQTT broker and InfluxDB, consuming MQTT messages and writing them as InfluxDB measurements. Install it:
sudo apt install telegraf -yEdit /etc/telegraf/telegraf.conf and add these sections:
[[outputs.influxdb_v2]]
  urls = ["http://127.0.0.1:8086"]
  token = "YOUR_INFLUX_TOKEN"
  organization = "home"
  bucket = "iot_sensors"

[[inputs.mqtt_consumer]]
  servers = ["tcp://127.0.0.1:1883"]
  topics = [
    "home/#",
  ]
  qos = 0
  data_format = "value"
  data_type = "float"
Restart Telegraf: sudo systemctl restart telegraf
Now every MQTT message published by your ESP32 nodes will automatically flow into InfluxDB. The MQTT topic structure (home/livingroom/temperature) becomes the measurement name in InfluxDB.
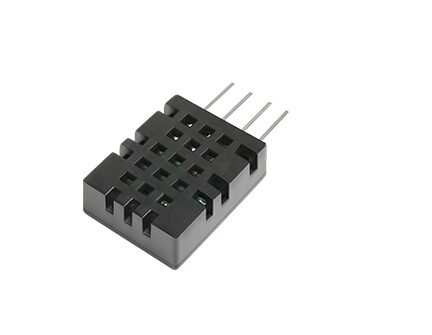
DHT20 SIP Packaged Temperature and Humidity Sensor
The DHT20 is an upgraded DHT11/22 replacement using I2C instead of a one-wire protocol — simpler wiring and better accuracy for multi-room Grafana monitoring setups.
Building Your Grafana Dashboard
Now for the fun part — visualising your sensor data. In Grafana:
- Click + → New Dashboard → Add a new panel
- Select your InfluxDB data source
- Write a Flux query to pull your temperature data:
from(bucket: "iot_sensors")
  |> range(start: v.timeRangeStart, stop: v.timeRangeStop)
  |> filter(fn: (r) => r["topic"] == "home/livingroom/temperature")
  |> aggregateWindow(every: v.windowPeriod, fn: mean, createEmpty: false)
Choose the Time series visualization type for temperature trends. Use Gauge for current readings, Stat for max/min, and Heatmap for day-of-week patterns.
Some popular dashboard layouts for Indian home monitoring:
- Climate Overview: Temperature and humidity for each room, last 24 hours
- Daily Patterns: Heatmap showing temperature by hour of day and day of week
- Weather Station: BME280 pressure history with monsoon prediction potential
- Energy Monitor: If you add a current sensor, track electricity usage by appliance
Setting Up Alerts and Notifications
Grafana’s built-in alerting can notify you when sensor values go out of range. This is extremely useful for:
- Temperature rising above 40°C in a server room or equipment cabinet
- Humidity exceeding 80% (mould risk during Indian monsoon season)
- A sensor going offline (no data received for 10 minutes)
Set up alerting under Alerting → Alert Rules → New Alert Rule. Choose your Flux query as the data source, set conditions (e.g. temperature > 40), and configure notification channels. Grafana supports email, Telegram, Slack, PagerDuty, and webhooks — all configurable under Alerting → Contact Points.
Telegram alerts for India: Creating a Telegram bot and using it as a Grafana contact point is extremely popular among Indian IoT enthusiasts. You get instant WhatsApp-like notifications on your phone when any sensor goes out of range.
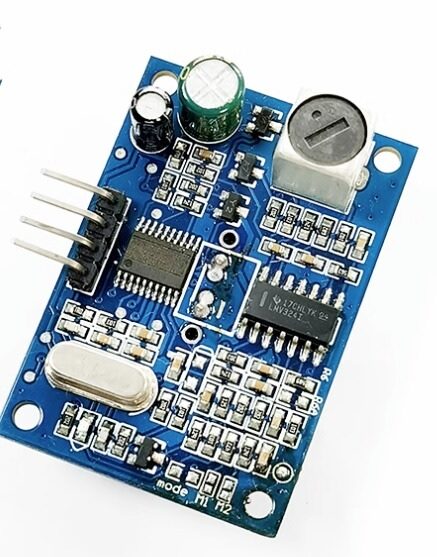
A86 JSN-SR04T Waterproof Ultrasonic Rangefinder Module
Monitor water tank levels automatically with this waterproof ultrasonic sensor and plot fill levels on your Grafana dashboard — a very popular project in Indian homes.
Frequently Asked Questions
Can I run Grafana and InfluxDB on a Raspberry Pi?
Yes — a Raspberry Pi 4 with 4GB RAM handles the full stack (Mosquitto + Telegraf + InfluxDB 2 + Grafana) comfortably with headroom to spare for up to 20–30 sensor nodes publishing every 30 seconds. On a Pi 3 you may need to increase swap space and reduce InfluxDB’s cache settings.
Do I need internet access for this setup to work?
No — the entire stack runs on your local network. Once set up, sensor data flows from ESP32 to MQTT to InfluxDB to Grafana without touching the internet. This makes it ideal for privacy-conscious setups and locations with unreliable internet.
What is the difference between InfluxDB v1 and v2?
InfluxDB v2 has a unified web UI, uses the Flux query language (more powerful than InfluxQL), and includes built-in tasks and alerting. InfluxDB v1 is still widely used (especially on Raspberry Pi due to lower resource usage) and uses InfluxQL which is similar to SQL. Both integrate with Grafana.
How many ESP32 sensor nodes can I connect to one Grafana/InfluxDB server?
A Pi 4 or a modest home server (Intel N100 mini-PC) can easily handle 50–100 sensor nodes publishing every 30 seconds. At this scale, InfluxDB’s compression means storage is very manageable — about 1GB per year for 50 nodes sending 2 fields every 30 seconds.
Can I access my Grafana dashboard from outside my home?
Yes — use Tailscale or WireGuard VPN to securely access your home server from anywhere. Avoid exposing Grafana directly to the internet without authentication. Tailscale is the easiest option and has a free tier that works well for personal use.
Build Your IoT Sensor Network with Zbotic
Zbotic stocks ESP32 boards, temperature sensors, humidity sensors, and all the components you need to build a professional IoT monitoring dashboard. Fast delivery across India.






Add comment