
Air pollution is an invisible health threat, and in Indian cities fine dust particles are among the most harmful pollutants. The Sharp GP2Y1010AU0F is an optical dust sensor capable of detecting particulate matter at concentrations as low as 0.1 mg/m³. At under ₹300, it is one of the most affordable air quality sensors available and can be connected directly to an Arduino to build a functional room air quality monitor. This tutorial covers everything from the sensor’s operating principle to a complete Arduino project with LCD display and alerts.
1. How the GP2Y1010AU Works
The GP2Y1010AU uses a nephelometric optical sensing principle. Inside the sensor body, an infrared LED illuminates a measurement chamber. A phototransistor positioned at 150° to the LED axis detects scattered light. When dust particles pass through the chamber, they scatter the IR beam toward the detector, producing a voltage spike proportional to particle concentration.
The sensing cycle works like this:
- The LED is pulsed ON for 0.32 ms (it should NOT be kept on continuously — this causes drift)
- After 0.28 ms (allowing the signal to stabilise), the Arduino samples the analog output
- The LED turns OFF for the remaining ~10 ms of the cycle
- The analog voltage is converted to dust density using the sensor’s characteristic curve
This pulsed operation is critical. The GP2Y1010AU is frequently wired incorrectly with the LED always on, producing saturated and useless readings.
What It Detects
The GP2Y1010AU detects particles greater than approximately 1 µm in diameter. This includes:
- PM10 dust particles
- Smoke (tobacco and cooking)
- Pollen and mould spores
- Coarse PM2.5 particles
It is not as accurate as dedicated laser-based PM2.5 sensors (like the PMS5003) for fine particle counting. But it gives reliable relative readings for home air quality monitoring and responds visibly to smoke events within seconds.
2. Sensor Specifications
| Parameter | Value |
|---|---|
| Supply Voltage (VCC) | 5.0 V ± 10% |
| LED Supply (V-LED) | 5.0 V (via 150 Ω resistor) |
| Output Voltage (clean air) | 0.9 V typical |
| Sensitivity | 0.5 V per 0.1 mg/m³ |
| Detection Range | 0–0.8 mg/m³ |
| Operating Temperature | −10°C to +65°C |
| LED Pulse Duration | 0.32 ms ON, ~10 ms period |
| Output | Analog voltage (0–3.5 V) |
| Connector | 6-pin JST connector |
3. Components Required
- Arduino Uno / Nano / Mega
- Sharp GP2Y1010AU0F dust sensor
- 150 Ω resistor (for LED current limiting)
- 220 µF electrolytic capacitor (decoupling — critical for stable readings)
- 16×2 LCD with I2C adapter (optional) or OLED display
- Jumper wires (6-pin JST to dupont, or solder directly)
- Breadboard
The 150 Ω resistor and 220 µF capacitor are part of the recommended LED drive circuit from the Sharp datasheet. Without the capacitor, the LED current pulse will cause a voltage spike on the 5 V rail that corrupts the analog reading. This is the single most common build mistake.
4. Wiring Diagram and Circuit
The GP2Y1010AU has a 6-pin JST connector. Pin numbering (from the sensor’s flat face, left to right):
| Pin # | Name | Connect to |
|---|---|---|
| 1 | V-LED | 5V via 150 Ω resistor; also 220 µF cap from V-LED to GND |
| 2 | LED-GND | Arduino GND |
| 3 | LED (pulse) | Arduino Digital Pin 7 (pulse control) |
| 4 | S-GND | Arduino GND |
| 5 | Vout | Arduino A0 (analog input) |
| 6 | VCC | Arduino 5V |
Circuit note: Place the 150 Ω resistor between Arduino 5 V and Pin 1 (V-LED). Place the 220 µF capacitor between Pin 1 (after the resistor) and GND, with the positive terminal toward Pin 1.
5. Arduino Code
// Sharp GP2Y1010AU Dust Sensor — Arduino Example
// LED control on Pin 7, analog output on A0

#define DUST_PIN      A0
#define LED_PIN       7
#define SAMPLE_COUNT  20  // average over 20 readings

// Sampling delays per Sharp datasheet
#define LED_ON_DELAY    280   // µs: wait before sampling
#define SAMPLE_DELAY    40    // µs: ADC sample time
#define LED_OFF_DELAY   9680  // µs: LED off time

void setup() {
  Serial.begin(115200);
  pinMode(LED_PIN, OUTPUT);
  digitalWrite(LED_PIN, LOW);
  Serial.println("GP2Y1010AU Dust Sensor Ready");
}

float readDustVoltage() {
  long sum = 0;
  for (int i = 0; i < SAMPLE_COUNT; i++) {
    digitalWrite(LED_PIN, LOW);   // LED ON (active low)
    delayMicroseconds(LED_ON_DELAY);
    int raw = analogRead(DUST_PIN);
    delayMicroseconds(SAMPLE_DELAY);
    digitalWrite(LED_PIN, HIGH);  // LED OFF
    delayMicroseconds(LED_OFF_DELAY);
    sum += raw;
  }
  // Convert ADC counts to voltage (5V reference, 10-bit ADC)
  return (sum / SAMPLE_COUNT) * (5.0 / 1023.0);
}

float voltToDustDensity(float voltage) {
  // Sharp characteristic: 0.5V per 0.1 mg/m3, Voffset ~0.9V
  // dustDensity (mg/m3) = (voltage - 0.9) / 5.0
  if (voltage < 0.9) return 0.0;  // below detection floor
  return (voltage - 0.9) / 5.0;
}

void loop() {
  float voltage = readDustVoltage();
  float dustMgM3 = voltToDustDensity(voltage);
  float dustUgM3 = dustMgM3 * 1000.0;  // convert to µg/m³

  Serial.print("Voltage: ");
  Serial.print(voltage, 3);
  Serial.print(" V  |  Dust: ");
  Serial.print(dustUgM3, 1);
  Serial.println(" µg/m³");

  delay(1000);  // 1-second reading interval
}
Open Serial Monitor at 115200 baud. In clean indoor air you should see values around 10–30 µg/m³. Light smoke (e.g., incense near the sensor) should produce values over 100 µg/m³ within seconds.
6. Calibration and Voltage-to-Dust Conversion
The conversion formula above is based on Sharp’s datasheet typical curve. In practice, your sensor’s zero-point offset (Voffset) may differ slightly from 0.9 V. To calibrate:
- Place the sensor in clean outdoor air away from traffic for 10 minutes
- Record the average output voltage — this is your Voffset
- Update the formula:
dustDensity = (voltage - Voffset) / 5.0
For cross-calibration with PM2.5 mass concentration (µg/m³), many researchers apply a correction factor based on particle density assumptions. A commonly used formula from community calibration work:
PM2.5 (µg/m³) ≈ 170 × Vout(V) − 0.1 × 1000
This is an approximation and accuracy varies by particle type. For regulatory-grade monitoring you need a calibrated PM2.5 laser sensor like the PMS5003.
7. Understanding Dust Levels and India AQI
| PM2.5 (µg/m³) | AQI Category | Health Message |
|---|---|---|
| 0–30 | Good | Minimal impact on health |
| 31–60 | Satisfactory | Minor breathing discomfort for sensitive people |
| 61–90 | Moderate | Breathing discomfort on prolonged exposure |
| 91–120 | Poor | Breathing discomfort on exertion |
| 121–250 | Very Poor | Respiratory illness on prolonged exposure |
| >250 | Severe | Affects healthy people, serious impact on diseased |
8. Project Improvements: Averaging, Logging, Alerts
Moving Average for Stable Readings
Dust density readings fluctuate naturally. Apply a 60-second moving average (60 samples at 1 per second) for stable display values while keeping real-time response for spike detection.
LED RGB Air Quality Indicator
Connect an RGB LED to pins 9, 10, 11 (PWM). Map AQI categories to colours: green (good), yellow (moderate), orange (poor), red (very poor), flashing red (severe). This gives instant visual feedback without looking at the display.
SD Card Data Logging
Add an SD card module to log timestamp, voltage, and dust density every minute. Analyse in Excel or Python to track daily air quality trends in your home or office.
IFTTT / Telegram Alerts via ESP8266
Replace the Arduino with an ESP8266 (Wemos D1 Mini) or add an ESP01 as a serial bridge. When dust exceeds 120 µg/m³, send a Telegram bot message or IFTTT webhook: “Air quality POOR — close windows!”
Combining with MQ-135 Gas Sensor
Add an MQ-135 gas sensor for ammonia, CO2, and VOC detection. The combination of particulate sensing (GP2Y1010AU) + gas sensing (MQ-135) gives a more complete air quality picture and is particularly useful for kitchen or workshop monitoring.
9. Related Sensors at Zbotic
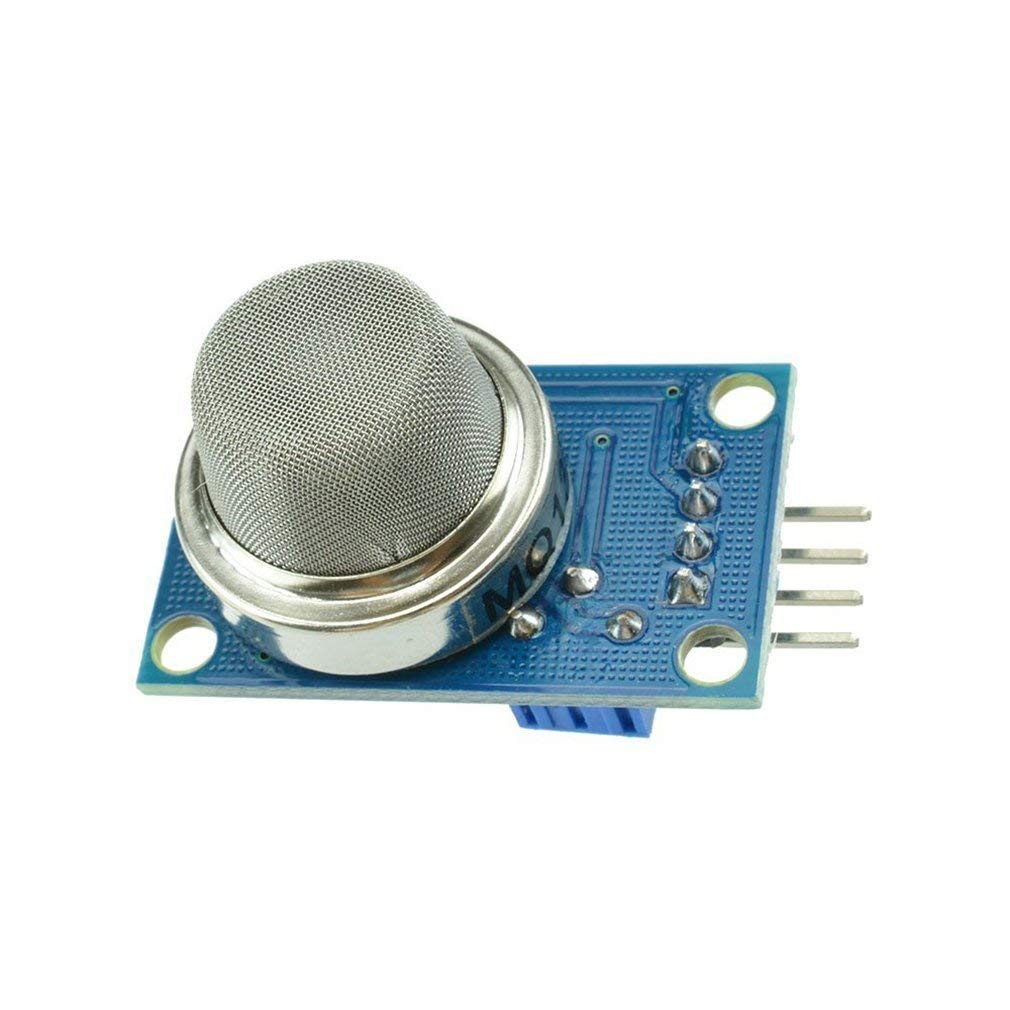
MQ-135 Air Quality / Gas Detector Sensor Module for Arduino
Detects NH3, NOx, alcohol, benzene, CO2. Combine with the GP2Y1010AU for a comprehensive indoor air quality monitor covering both particles and gases.
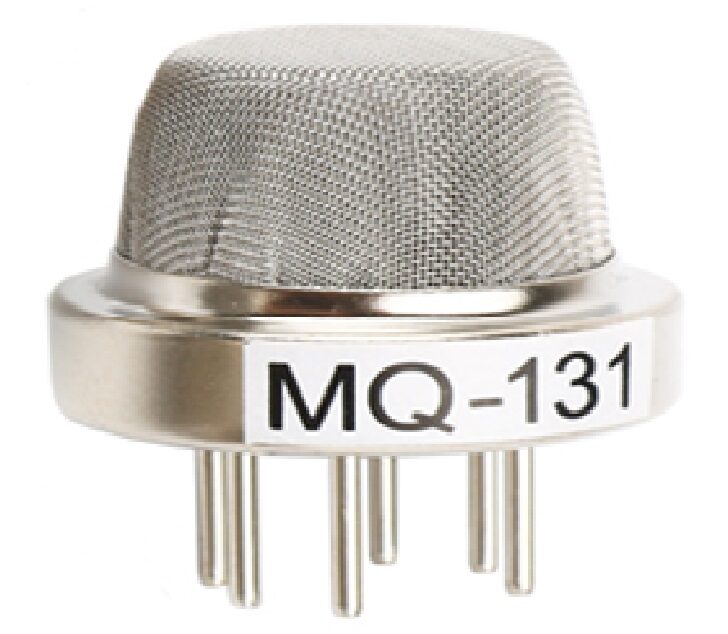
MQ-131 Ozone Gas Detection Sensor
Ground-level ozone is a serious pollutant linked to dust events. Add ozone detection to your air quality station for a complete outdoor pollution monitor.
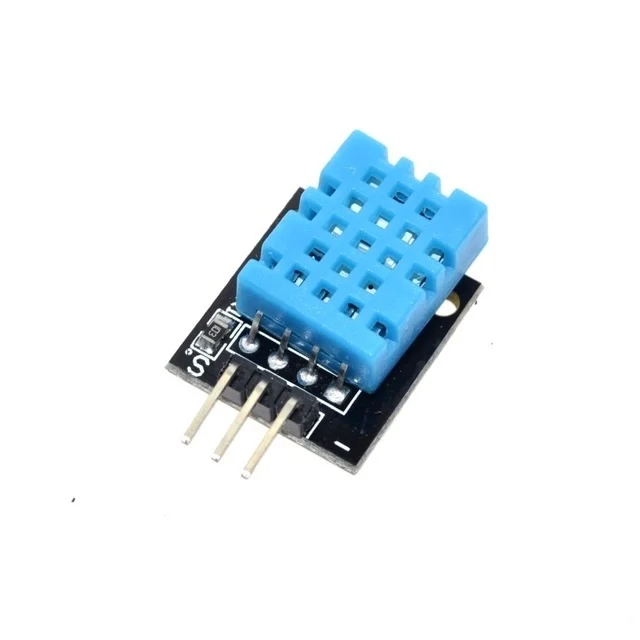
DHT11 Digital Humidity and Temperature Sensor Module
Humidity and temperature data complement dust readings — high humidity causes dust particles to clump and fall, while low humidity keeps them airborne longer.
10. Frequently Asked Questions
Q: Why does my GP2Y1010AU always read 0 or show no change?
The most common causes: (1) The LED control pin polarity is wrong — the LED is active LOW (drive the pin LOW to turn on). (2) Missing 220 µF decoupling capacitor on V-LED — without it, the supply droops during the pulse and corrupts the analog reading. (3) The sampling is not timed correctly — the ADC must sample 280 µs after the LED turns on.
Q: Can I use 3.3 V with the GP2Y1010AU?
Not directly. The sensor is rated for 5 V. At 3.3 V, the LED will be dim and sensitivity drops dramatically. If using a 3.3 V microcontroller (ESP32, ESP8266), power the sensor from a separate 5 V supply and use a voltage divider (2:1) on the analog output pin to scale 5 V → 2.5 V before connecting to the 3.3 V ADC input.
Q: How does the GP2Y1010AU compare to the PMS5003?
The GP2Y1010AU is an analog optical sensor measuring total optical density — it does not give separate PM2.5/PM10 counts. The PMS5003 is a laser-based sensor with a particle counter giving calibrated PM1.0, PM2.5, and PM10 in µg/m³. The PMS5003 is significantly more accurate and suitable for regulatory-grade monitoring; the GP2Y1010AU is better for low-cost relative detection and trend monitoring.
Q: How long does the sensor last?
Sharp specifies the GP2Y1010AU for over 30,000 hours of continuous operation. In practice, the LED does dim slightly over years of use. In heavily polluted environments, dust can accumulate inside the sensing chamber and reduce sensitivity. Occasional gentle cleaning with compressed air helps maintain performance.
Q: Can this sensor detect COVID-19 or viruses?
No. Viruses are typically 0.02–0.3 µm in size — far below the ~1 µm detection threshold of the GP2Y1010AU. This sensor detects coarse particulate matter, not biological agents. No low-cost optical dust sensor can reliably detect airborne viruses.
Build Your Own Air Quality Monitor
Find gas sensors, temperature/humidity modules, and all the components you need for environmental monitoring projects at Zbotic — fast delivery across India.


Add comment