
Water quality monitoring has become a critical part of modern agriculture, aquaculture, industrial processes, and smart city infrastructure. At the centre of many water monitoring systems sits the turbidity sensor — a deceptively simple device that measures how cloudy or murky a water sample is by detecting the amount of light scattered by suspended particles. Whether you are building a DIY river pollution alert, an automated fish tank cleaner, or an industrial effluent monitoring station, understanding how turbidity sensors work and how to integrate them into an IoT system is an essential skill for every maker and engineer.
This comprehensive tutorial walks you through everything: the physics behind turbidity measurement, choosing the right module, wiring it to an Arduino or ESP32, writing clean firmware, calibrating your readings in NTU (Nephelometric Turbidity Units), and transmitting data to an IoT dashboard. By the end you will have a fully functional water clarity monitoring node ready for deployment.
1. What Is Turbidity and Why Does It Matter?
Turbidity is a measure of the optical clarity of a liquid. High turbidity means the liquid is cloudy or opaque because it contains suspended particles — sediment, algae, bacteria, organic matter, or industrial pollutants. Low turbidity means the liquid is clear. The standard unit is the NTU (Nephelometric Turbidity Unit), measured at a 90-degree scattering angle according to ISO 7027.
To give you a sense of scale: drinking water should be below 1 NTU (WHO guideline), tap water in India typically sits between 0.1–4 NTU, rivers during monsoon can spike above 1000 NTU, and heavily polluted industrial discharge can exceed 4000 NTU.
From an IoT perspective, turbidity is one of the most actionable water quality parameters because it responds quickly to pollution events, sediment runoff after rain, algal blooms, and equipment failure — making it ideal for real-time alerting systems.
2. How a Turbidity Sensor Works
The working principle of a turbidity sensor is based on the interaction of light with suspended particles in water. There are two primary detection methods:
Nephelometric (90° Scatter)
An IR or visible light LED shines into the water sample. A photodetector positioned at 90 degrees to the light source measures the intensity of light scattered by particles. More particles scatter more light — so a higher photodetector reading indicates higher turbidity. This is the method mandated by ISO 7027 and used in most laboratory-grade instruments.
Transmission (180° / Forward Scatter)
A photodetector is placed directly opposite the light source. As turbidity increases, the transmitted light intensity decreases. This method is simpler to implement and is used in most low-cost hobby modules (like the TS-300B and DFRobot SEN0189). It works well for relative measurements but becomes inaccurate at very high turbidity because the relationship between transmission and NTU is non-linear.
Most commonly available modules in India use the transmission method and output either a raw analogue voltage (0–5 V proportional to clarity) or a digital HIGH/LOW signal when turbidity crosses a threshold set by a potentiometer.
3. Types of Turbidity Sensor Modules
Generic 3-Pin Turbidity Sensor Module
The most common and affordable option. Provides a digital output (D0) and an analogue output (A0). Uses a visible-light LED and phototransistor. Operating voltage: 5 V. Suitable for basic threshold-based alerts in aquariums, plant watering systems, and educational projects.
DFRobot SEN0189
A gravity-connector module with a waterproof stainless-steel probe. Outputs 0–4.5 V analogue, with 0 V corresponding to high turbidity and 4.5 V to clean water. Includes a signal conditioning board. Compatible with 3.3 V and 5 V systems. The probe is fully immersible and rated for long-term deployment.
Industrial RS485 / Modbus Turbidity Sensors
These are 4–20 mA or RS485 Modbus RTU devices used in wastewater treatment plants and industrial monitoring. They have a much wider NTU range (0–4000 NTU), are chemically resistant, and often combine turbidity with pH and dissolved oxygen in a multi-parameter probe. Integration into IoT systems requires an RS485-to-UART adapter or an industrial gateway.
4. Wiring the Turbidity Sensor to Arduino / ESP32
For this tutorial we use the generic analogue turbidity module (commonly available on Zbotic and similar stores) with an Arduino Uno. The wiring is straightforward:
| Turbidity Module Pin | Arduino Uno Pin |
|---|---|
| VCC | 5 V |
| GND | GND |
| A0 (Analogue Out) | A0 |
| D0 (Digital Out) | D2 (optional) |
For ESP32 (3.3 V logic), add a voltage divider on the analogue line: two 10 kΩ resistors forming a 5V→2.5 V divider. Connect the midpoint to an ADC-capable GPIO (e.g. GPIO34). Alternatively, power the module from 3.3 V and accept a slightly reduced output swing — the module still functions correctly at 3.3 V supply.
Important: Never submerge the module PCB — only the sensor probe goes into the water. Keep the circuit board dry and sealed.
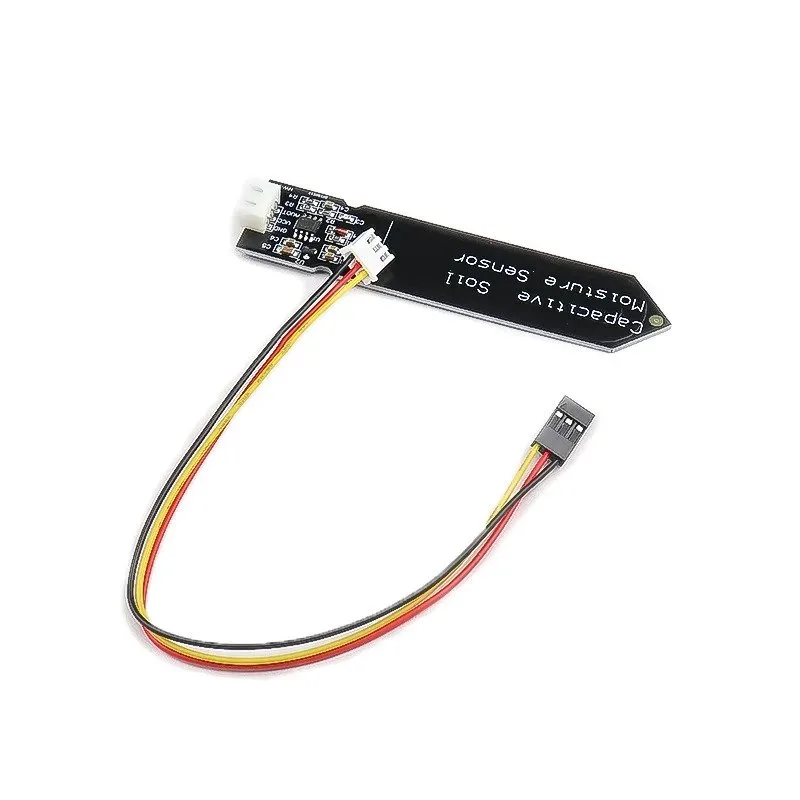
Capacitive Soil Moisture Sensor
Pairs perfectly with water quality projects — monitor soil moisture alongside water turbidity in smart irrigation and environmental monitoring systems.
5. Arduino Code: Reading and Converting to NTU
The voltage-to-NTU relationship for transmission-based sensors is non-linear. DFRobot provides the following empirical polynomial for the SEN0189 at 25 °C:
// Turbidity Sensor - Arduino Tutorial
// Zbotic.in

#define TURBIDITY_PIN A0
#define NUM_SAMPLES 800

void setup() {
  Serial.begin(9600);
  analogReference(DEFAULT); // 5V Aref for Uno
}

void loop() {
  float voltage = readTurbidityVoltage();
  float ntu = voltageToNTU(voltage);

  Serial.print("Voltage: ");
  Serial.print(voltage, 3);
  Serial.print(" V  |  Turbidity: ");
  Serial.print(ntu, 1);
  Serial.println(" NTU");

  delay(1000);
}

float readTurbidityVoltage() {
  long sum = 0;
  for (int i = 0; i < NUM_SAMPLES; i++) {
    sum += analogRead(TURBIDITY_PIN);
    delay(0);
  }
  float avg = sum / (float)NUM_SAMPLES;
  return avg * (5.0 / 1023.0); // Convert to voltage
}

float voltageToNTU(float voltage) {
  // Empirical polynomial from DFRobot (valid 2.5–4.2 V range)
  if (voltage  4.2) return 0.0;    // Clear water
  float ntu = -1120.4 * voltage * voltage
              + 5742.3 * voltage
              - 4352.9;
  return max(0.0f, ntu);
}
Key points about the code:
- Averaging 800 samples dramatically reduces noise — turbidity sensors are sensitive to vibration and ambient light.
- The polynomial is valid between approximately 2.5 V (very turbid) and 4.2 V (clear water).
- At voltages below 2.5 V, the sensor is saturated and you should report a maximum turbidity value.
- Always take readings in a dark or shaded environment if possible — ambient light entering the probe can skew readings by 5–10%.
ESP32 Version (with Wi-Fi)
// ESP32 Turbidity — read on ADC channel
#define TURBIDITY_PIN 34  // Only ADC1 pins work reliably

float readTurbidityVoltage() {
  long sum = 0;
  for (int i = 0; i < 800; i++) sum += analogRead(TURBIDITY_PIN);
  float avg = sum / 800.0;
  // ESP32 ADC: 12-bit (0-4095), Vref ~3.3V (with calibration offset)
  return avg * (3.3 / 4095.0) * 2.0; // x2 for voltage divider
}
6. Calibrating Your Sensor
Raw voltage readings from hobby turbidity sensors carry an error of ±10–20% without calibration. Here is a practical two-point calibration procedure using available materials:
Step 1: Clear Water Baseline (0 NTU)
Use distilled water or deionised water in a clean, dark container. Record the average voltage output. This is your V_clear reference. In the code, use this to set a zero offset.
Step 2: Known Turbidity Standard
Prepare a Formazin dilution or use a commercially available 100 NTU calibration solution (available from chemistry suppliers in India). Record the voltage. Use these two points to define a linear calibration curve for the range of interest.
Step 3: Temperature Compensation
Turbidity readings vary with temperature because water viscosity changes particle settling rate and the refractive index changes. If your system spans a wide temperature range, pair the turbidity sensor with a DS18B20 temperature sensor and apply a correction factor of approximately +1.5% per °C above 25 °C.

DS18B20 Programmable Resolution
Waterproof temperature sensor ideal for temperature compensation in turbidity measurements and multi-parameter water quality monitoring.
7. IoT Integration: Sending Data to a Dashboard
Once you can read clean NTU values on Serial, the next step is transmitting them to an IoT platform. Here we use MQTT over Wi-Fi with an ESP32 and publish to a Mosquitto broker, which feeds into Node-RED and Grafana — a fully free, self-hosted stack.
#include <WiFi.h>
#include <PubSubClient.h>
#include <ArduinoJson.h>

const char* ssid = "YOUR_SSID";
const char* password = "YOUR_PASSWORD";
const char* mqttServer = "192.168.1.100"; // Broker IP
const int mqttPort = 1883;
const char* topic = "water/turbidity";

WiFiClient espClient;
PubSubClient client(espClient);

void publishTurbidity(float ntu, float voltage) {
  StaticJsonDocument<128> doc;
  doc["ntu"] = ntu;
  doc["voltage"] = voltage;
  doc["status"] = ntu < 10 ? "CLEAR" :
                  ntu < 100 ? "MODERATE" : "TURBID";
  char buf[128];
  serializeJson(doc, buf);
  client.publish(topic, buf);
}

// Reconnect and loop logic omitted for brevity
// See Zbotic blog for full sketch
Threshold Alerting
Define alert levels in your Node-RED flow or directly in firmware:
- Green (0–10 NTU): Clean water — no action needed
- Yellow (10–100 NTU): Moderate — trigger pump or filter
- Red (>100 NTU): High turbidity — send SMS/email alert via Twilio or SendGrid
Data Logging to ThingSpeak
For simpler projects, ThingSpeak provides a free 8-channel cloud dashboard. Replace the MQTT publish with an HTTP GET to the ThingSpeak API. Log hourly averages to stay within the free tier’s 3-second rate limit.
8. Real-World Applications
Smart Aquarium / Fish Tank Monitor
Monitor tank turbidity continuously and trigger an auto-drain-and-refill cycle when NTU exceeds a threshold. Combine with a DS18B20 for temperature and a pH sensor for a complete aquarium health dashboard.
River / Lake Pollution Alert
Deploy solar-powered ESP32 nodes along a river. Each node reads turbidity every 5 minutes and pushes data via LoRa to a central gateway. Sudden NTU spikes indicate illegal effluent discharge upstream — useful for NGOs and pollution control boards.
Agricultural Irrigation Water Quality
Sediment-heavy water can clog drip irrigation nozzles. An inline turbidity sensor on the main supply line can automatically shut off the pump when sediment load is too high, protecting expensive drip emitters.
Industrial Effluent Monitoring
Indian environmental regulations (CPCB) mandate turbidity monitoring for certain categories of industrial discharge. A turbidity sensor at the effluent outfall, combined with a GSM/LTE logger, can generate automated compliance reports.

MQ-135 Air Quality / Gas Detector Sensor
Build a comprehensive environmental monitoring station — combine turbidity sensing with air quality measurement using the MQ-135 for multi-parameter pollution tracking.
9. Troubleshooting Common Issues
Readings Are Unstable / Jumping Wildly
Almost always caused by insufficient averaging or electrical noise. Increase sample count to 1000+, add a 100 nF decoupling capacitor between VCC and GND on the module, and ensure the power supply is clean. On ESP32, use only ADC1 pins (GPIO32–39) as ADC2 is unusable when Wi-Fi is active.
Sensor Always Reads 0 NTU
Check that the probe is fully inserted into the water sample. If using a module with a separate signal conditioning board, verify the board is getting 5 V and the analogue output wire is connected to the correct Arduino pin. Also check that the LED inside the probe is lighting up (you can see the red/IR glow with a phone camera).
Readings Don’t Match a Reference Meter
Hobby modules are calibrated for transmission-mode measurement and the empirical polynomial is an approximation. For accuracy within ±5 NTU, perform a two-point calibration with known turbidity standards. Also ensure both instruments are measuring the same sample at the same temperature.
Sensor Fouls Quickly in Field Deployment
Biofouling — algae and bacteria growing on the optical surfaces — is the number-one maintenance issue in long-term deployments. Clean the probe windows weekly with isopropyl alcohol. For automated self-cleaning, small ultrasonic transducers mounted near the probe can dislodge biofilm before each reading.
Frequently Asked Questions
Q: What is the difference between NTU, FTU, and JTU?
NTU (Nephelometric Turbidity Unit), FTU (Formazin Turbidity Unit), and JTU (Jackson Turbidity Unit) are all units for measuring turbidity but use different methods. NTU and FTU are practically equivalent (both measure 90° scatter from Formazin standards). JTU is an older visual method and 1 JTU ≈ 19 NTU. For IoT projects, always report in NTU.
Q: Can I use a turbidity sensor in seawater or chlorinated water?
Yes, but the optical properties of the medium affect accuracy. Chlorine adds a slight yellow tint that absorbs some wavelengths, and seawater has a higher refractive index than freshwater. If measuring non-freshwater, recalibrate with standards prepared in the same medium.
Q: What is the maximum NTU a hobby sensor can measure?
Transmission-based hobby sensors typically saturate above 1000–3000 NTU. Above this, the sensor output voltage flatlines and you cannot distinguish differences. For high-turbidity applications (e.g. slurry monitoring), use a nephelometric or backscatter sensor instead.
Q: How do I power a turbidity sensor node from a battery?
For battery-powered deployments, put the ESP32 into deep sleep between readings. Wake up every 5 minutes, read turbidity (takes ~2 seconds of averaging), publish via MQTT, and return to deep sleep. A 3000 mAh LiPo with a TP4056 charging module and a 5 W solar panel can sustain continuous operation indefinitely.
Q: Is the turbidity sensor suitable for measuring milk or juice turbidity in food processing?
Technically yes, but standard water sensors are not rated for food contact (materials are not food-grade). Dedicated food-grade turbidity probes with PTFE housings are available for food processing applications. The measurement principle and Arduino integration are identical.
Conclusion
The turbidity sensor is one of the most practical and affordable tools in the IoT sensor toolkit. With just a few rupees’ worth of hardware, an Arduino or ESP32, and the code and calibration techniques covered in this tutorial, you can build a real-time water clarity monitoring system suitable for everything from a classroom experiment to a field-deployed pollution alert network.
The key takeaways: average many samples to reduce noise, calibrate with known standards for accuracy, compensate for temperature in wide-range deployments, and protect your probe from biofouling in long-term installations. Pair your turbidity sensor with temperature, pH, and dissolved oxygen sensors to build a complete water quality monitoring platform.
Ready to Build Your Water Quality Monitor?
Find sensors, microcontrollers, and all components at Zbotic — India’s trusted electronics store for makers and engineers.


Add comment