
Every hobbyist, engineering student, or professional who has ever worked with sensors has encountered the terms accuracy and precision. These two words are often used interchangeably in everyday conversation, but in the world of measurement and instrumentation, they describe fundamentally different characteristics of a sensor. Confusing them can lead to poor sensor selection, misinterpreted data, and unreliable systems. This guide explains the difference in plain terms, uses concrete examples from common sensors, and helps you choose the right sensor for your specific application.
1. Definitions: Accuracy and Precision
Accuracy describes how close a sensor’s measurement is to the true (real) value. A thermometer that reads 99.8°C when the actual temperature is 100.0°C is highly accurate — the reading is very close to reality, off by only 0.2°C.
Precision (also called repeatability or reproducibility) describes how consistent a sensor’s measurements are when measuring the same quantity multiple times. A thermometer that consistently reads 97.5°C every single time the temperature is actually 100.0°C is highly precise but not accurate — all readings cluster together, but they are all wrong by the same amount.
The crucial takeaway: a sensor can be precise without being accurate, accurate without being very precise, both, or neither. Understanding this distinction is essential for selecting and using sensors correctly.
2. The Dart Board Analogy
The classic way to visualise accuracy vs precision is the dart board. Imagine throwing darts at a board where the bullseye represents the true value.
- High Accuracy, High Precision: All darts cluster tightly around the bullseye. This is the ideal sensor — consistent and correct.
- Low Accuracy, High Precision: All darts cluster tightly together, but far from the bullseye. The sensor reliably gives the same wrong answer — this is a systematic error.
- High Accuracy, Low Precision: Darts are scattered around the bullseye but not tightly grouped. On average, the sensor is correct, but individual readings vary widely — this is random noise.
- Low Accuracy, Low Precision: Darts are scattered everywhere with no pattern. This sensor is useless — it is both wrong and inconsistent.
In real-world sensor applications, low precision (high random noise) can sometimes be improved by averaging multiple readings. Low accuracy (systematic error) generally cannot be fixed by averaging — it requires calibration against a known reference.
3. Understanding Sensor Accuracy Specifications
When you read a sensor datasheet, accuracy is usually expressed in one of these forms:
- Absolute accuracy: A fixed error in measurement units. Example: “±2°C” means the sensor may read up to 2°C above or below the true value, regardless of what the actual temperature is.
- Percent of full scale (% FS): Error as a percentage of the sensor’s maximum range. A pressure sensor with 1000 Pa full scale and ±1% FS accuracy has an absolute error of ±10 Pa at any point in the range.
- Percent of reading (% RDG): Error proportional to the actual measured value. More common in measurement equipment than bare sensors. ±0.5% RDG means the error scales with the signal.
For the DHT11 temperature sensor, the datasheet specifies ±2°C accuracy. This means that if you are measuring 25°C, the reading could be anywhere from 23°C to 27°C and still be within specification. This is typical for a low-cost sensor.
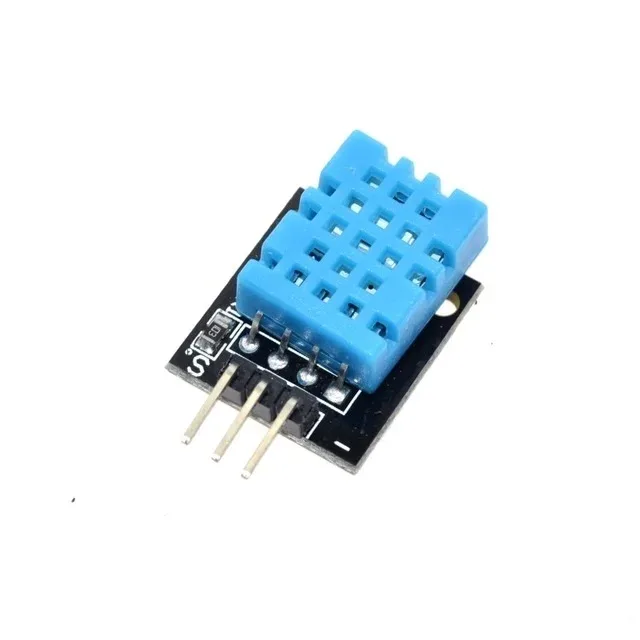
DHT11 Digital Humidity and Temperature Sensor Module
A popular, low-cost sensor ideal for learning — its ±2°C accuracy and 1°C resolution make it a great hands-on example of accuracy vs precision trade-offs in budget sensors.
4. Understanding Sensor Precision Specifications
Precision on a datasheet may appear as:
- Repeatability: How much the output varies across multiple measurements of the same input under the same conditions. Often expressed as ±X units or ±X% FS.
- Noise (RMS or peak-to-peak): Electrical noise in the signal, expressed in the sensor’s output units. Closely related to precision but specifically describes the random variation component.
- Resolution: The smallest change in the measured quantity that produces a detectable change in output. A sensor with 0.1°C resolution can distinguish between 24.9°C and 25.0°C, but one with 1°C resolution cannot. High resolution enables high precision but does not guarantee accuracy.
The DS18B20 temperature sensor, for instance, offers up to 12-bit resolution (0.0625°C increments) and a repeatability spec far better than the DHT11. It can resolve changes smaller than 0.1°C and reports consistent values on repeat measurements. Its absolute accuracy is ±0.5°C — better than the DHT11 but still an offset that requires calibration for clinical-grade applications.

DS18B20 Programmable Resolution Temperature Sensor
Offers up to 12-bit resolution (0.0625°C steps) and ±0.5°C accuracy — a great step up from DHT11 for applications where both precision and accuracy matter.
5. Related Terms: Resolution, Repeatability, and Drift
To fully understand sensor specifications, you need to be familiar with a cluster of related terms:
Resolution is the granularity of the sensor’s output. A 10-bit ADC reading a 3.3V range has a resolution of 3.3V / 1024 = ~3.2 mV per step. Increasing ADC bits increases resolution. Resolution sets the ceiling on achievable precision — you cannot have better precision than your resolution.
Repeatability is precision under identical conditions (same operator, same environment, short time frame). Reproducibility extends this to different conditions (different days, different labs). Repeatability is always better than reproducibility.
Hysteresis is when a sensor reads different values depending on whether the measured quantity is increasing or decreasing. A pressure sensor might read 102 kPa on the way up and 101.5 kPa on the way back down at the same true pressure. Hysteresis is a form of systematic error.
Drift is a slow, gradual change in a sensor’s output over time or temperature without any change in the actual measured quantity. Gas sensors like the MQ series are notorious for drift — they require periodic recalibration in long-term deployments.
Non-linearity is when the sensor’s response is not proportional across its full range. A linear sensor has the same sensitivity everywhere. A non-linear sensor may be accurate at mid-range but have larger errors at the extremes.
6. Accuracy vs Precision in Common Sensors
Let us compare some sensors popular with Indian hobbyists:
| Sensor | Accuracy | Resolution | Best Use |
|---|---|---|---|
| DHT11 | ±2°C, ±5% RH | 1°C, 1% RH | Learning projects, room monitoring |
| DHT20 | ±0.5°C, ±3% RH | 0.01°C, 0.024% RH | HVAC, data loggers |
| DS18B20 | ±0.5°C | 0.0625°C (12-bit) | Water temp, pipelines |
| LM35 | ±0.5°C typ (25°C) | Depends on ADC | Analog circuits, quick prototyping |
| BME280 | ±0.5°C, ±3% RH, ±1 hPa | 0.01°C, 0.008% RH | Weather stations, altitude |
| ACS712 (20A) | ±1.5% of full scale | Depends on ADC | Power monitoring, motor control |
Notice that the DHT11 has coarser resolution (1°C) than its accuracy specification (±2°C). This means that even its rounding quantisation alone accounts for 0.5°C, but the sensor’s systematic offset can be much larger. In contrast, the DS18B20’s resolution of 0.0625°C is far finer than its accuracy of ±0.5°C — its precision is excellent, and with one-point calibration (adjusting for the known offset), its effective accuracy improves dramatically.

DHT20 SIP Packaged Temperature and Humidity Sensor
The DHT20 dramatically improves on the DHT11 with ±0.5°C accuracy and much finer resolution — an ideal upgrade when precision starts to matter for your project.
7. How Calibration Improves Accuracy
Calibration is the process of comparing a sensor’s output to a known reference and adjusting for any offset. It directly addresses accuracy (systematic error) but does not reduce random noise (precision).
A one-point calibration corrects for offset: if your DS18B20 consistently reads 0.3°C low compared to a certified thermometer, you add 0.3 to every reading in software. A two-point calibration corrects for both offset and gain (span), useful for sensors with non-linear response across their range.
For temperature sensors, a practical calibration method for hobbyists is ice water (0°C reference) and boiling water (100°C at sea level, lower at altitude). Measure both reference points, calculate the offset and gain error, and apply a linear correction formula.
Calibration does not last forever. Sensors drift over time, especially those that are exposed to harsh environments, chemicals, or extreme temperatures. Mission-critical applications should define a recalibration schedule — typically annual for HVAC sensors, quarterly for gas sensors, and monthly for medical devices.
8. Choosing the Right Sensor for Your Application
Here is a practical framework for sensor selection based on accuracy and precision requirements:
Step 1 — Define your acceptable error budget. What is the maximum error your system can tolerate and still function correctly? An aquarium heater might tolerate ±2°C; a pharmaceutical storage monitor needs ±0.3°C.
Step 2 — Determine if accuracy or precision matters more. For control systems that measure relative changes (temperature trend, vibration frequency), precision matters more — the control loop corrects for absolute offset automatically. For absolute reporting (“this batch was stored at 8°C”), accuracy is paramount.
Step 3 — Check environmental conditions. Operating temperature range, humidity, vibration, and chemical exposure all degrade sensor performance. Ensure the sensor’s rated operating range covers your deployment environment with margin.
Step 4 — Consider long-term stability. Low-cost sensors may perform acceptably when new but drift significantly over months of operation. Factor in recalibration cost and frequency.
Step 5 — Match resolution to your required precision. There is no benefit in paying for 12-bit resolution if your application only needs 1°C granularity. Conversely, do not use a 1°C resolution sensor if you need to detect 0.2°C changes.
9. Sources of Sensor Error
Understanding where errors originate helps in designing more reliable measurement systems:
- Self-heating: Sensors that draw current generate heat, which can bias temperature readings. The DHT11 should be read infrequently and not powered continuously in still-air environments to avoid self-heating errors.
- Loading error: Some sensors change the quantity they are measuring. A clamp ammeter placed around a thin wire can slightly alter the wire’s impedance. A thermometer inserted into a small water sample changes its temperature slightly.
- Electromagnetic interference (EMI): Long sensor cable runs act as antennas. Always use shielded cable and good grounding for sensitive analog sensors in noisy industrial environments. Digital sensors (I2C, 1-Wire) are more immune to EMI.
- Supply voltage variation: Many analog sensors (including the LM35) output a voltage proportional to their supply voltage. Fluctuations in your 5V or 3.3V rail translate directly into measurement errors. Use a stable, low-noise voltage reference for precision applications.
- Mounting and placement: A temperature sensor mounted next to a heat-generating component will read artificially high. A soil moisture sensor that is air-exposed gives invalid readings. Physical placement is often the largest source of practical error.
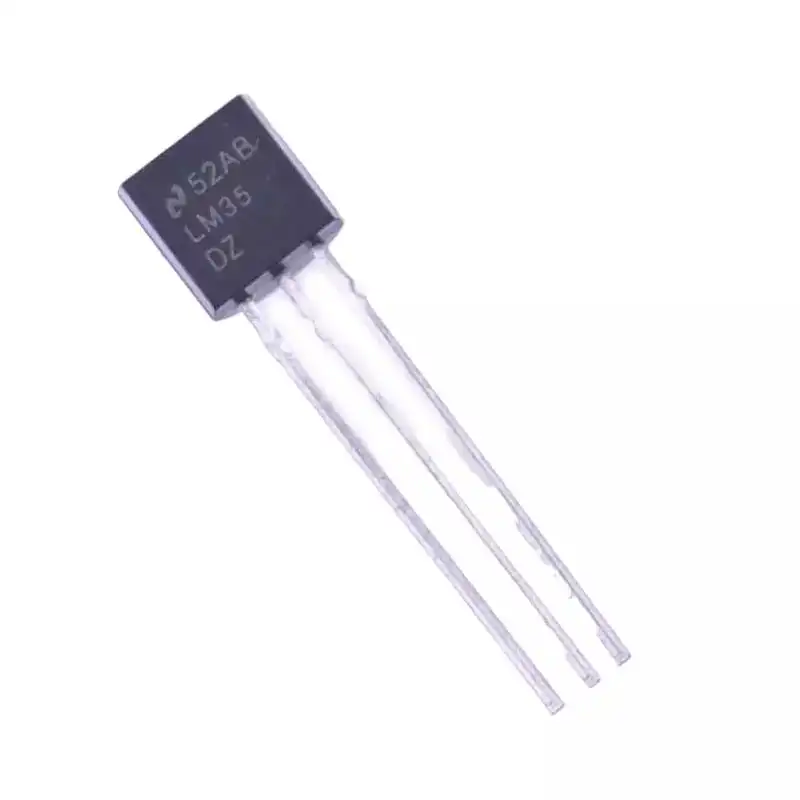
LM35 Temperature Sensor
A classic analog temperature sensor with ±0.5°C typical accuracy, great for understanding the relationship between sensor accuracy, ADC resolution, and supply voltage noise.
Frequently Asked Questions
Can averaging many readings improve accuracy?
Averaging improves precision (reduces random noise) but does NOT improve accuracy. If a sensor has a systematic offset of +1.5°C, averaging a thousand readings still gives you +1.5°C. To improve accuracy you must calibrate — measure against a reference and correct the offset in software or hardware.
Is a more expensive sensor always more accurate?
Generally yes, but not always. More expensive sensors are usually better characterised, have tighter tolerances from the factory, and include calibration certificates. However, the biggest gains often come from proper installation, good circuit design, and periodic recalibration rather than spending more on the sensor itself.
What does ±2% FS mean on a sensor datasheet?
FS stands for Full Scale — the sensor’s maximum measurement range. ±2% FS means the absolute error is ±2% of the maximum range value, regardless of what you are actually measuring. For a 0–100 kPa pressure sensor, this is ±2 kPa at any point. This specification gets relatively worse when you measure near the low end of the range.
How do I know if my sensor reading error is systematic or random?
Take many readings at a stable known value and plot them as a histogram. If the spread is centred on the true value, the error is predominantly random (precision problem). If the centre of the spread is offset from the true value, there is a systematic error (accuracy problem). If the spread is wide AND offset, you have both problems.
Does temperature affect sensor accuracy?
Yes, almost universally. Datasheets specify accuracy at a reference temperature (usually 25°C). Additional temperature coefficients specify how accuracy degrades as ambient temperature moves away from this reference. High-quality sensors include temperature compensation circuits. For low-cost sensors used in extreme temperatures, expect accuracy to degrade beyond datasheet specs.
Find the Right Sensor for Your Project
Zbotic offers a wide range of temperature, humidity, pressure, and environmental sensors — from budget DHT11 modules to high-precision options for demanding applications.


Add comment