
Building a real-time sensor dashboard is one of the most satisfying IoT projects you can do with an ESP32. In this comprehensive guide, we will walk you through setting up an ESP32 MQTT Node-RED pipeline that collects sensor data, publishes it over MQTT, and visualises it on a beautiful browser-based dashboard — all running locally on your own network or on a cloud VPS.
1. What is MQTT and Why Use It with ESP32?
MQTT (Message Queuing Telemetry Transport) is a lightweight publish-subscribe messaging protocol designed for constrained devices and low-bandwidth networks. It was originally developed by IBM and is now an ISO standard (ISO/IEC 20922:2016). For IoT projects, MQTT is vastly superior to plain HTTP polling because:
- Low overhead: A minimal MQTT packet header is only 2 bytes, compared to hundreds of bytes for an HTTP request.
- Pub/Sub model: The ESP32 publishes sensor readings to a topic; any number of subscribers (Node-RED, mobile apps, other microcontrollers) instantly receive the data.
- QoS levels: Choose fire-and-forget (QoS 0), at-least-once (QoS 1), or exactly-once (QoS 2) delivery guarantees.
- Retained messages: New subscribers immediately get the last known sensor value without waiting for the next publication.
- Low power friendly: ESP32 can publish a reading and return to deep sleep in under 100 ms, saving battery life.
Node-RED is a flow-based visual programming tool built on Node.js. It runs on a Raspberry Pi, a Linux server, or even Windows. Its drag-and-drop interface lets you connect MQTT nodes, process JSON, write to databases, send WhatsApp/Telegram alerts, and render a live dashboard — no complex backend code required.
2. Components You Will Need
Here is the complete bill of materials for this project:
- ESP32 development board (NodeMCU-32S or similar)
- DHT22 or DHT11 temperature & humidity sensor
- BMP280 barometric pressure sensor (optional)
- Breadboard and jumper wires
- Micro USB cable
- A PC or Raspberry Pi to run Mosquitto + Node-RED
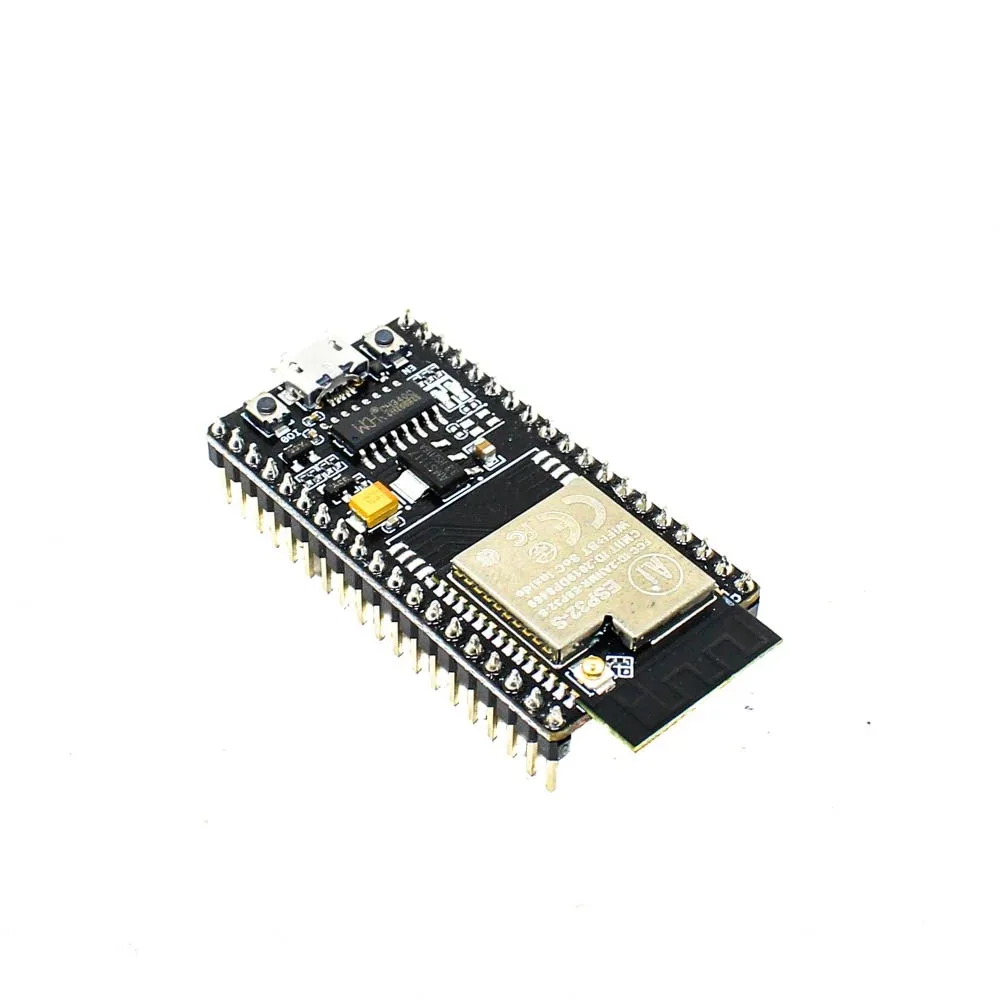
Ai Thinker NodeMCU-32S-ESP32 Development Board – IPEX Version
Dual-core 240 MHz ESP32 board with 30 GPIO pins, built-in Wi-Fi and Bluetooth — perfect for MQTT sensor projects.
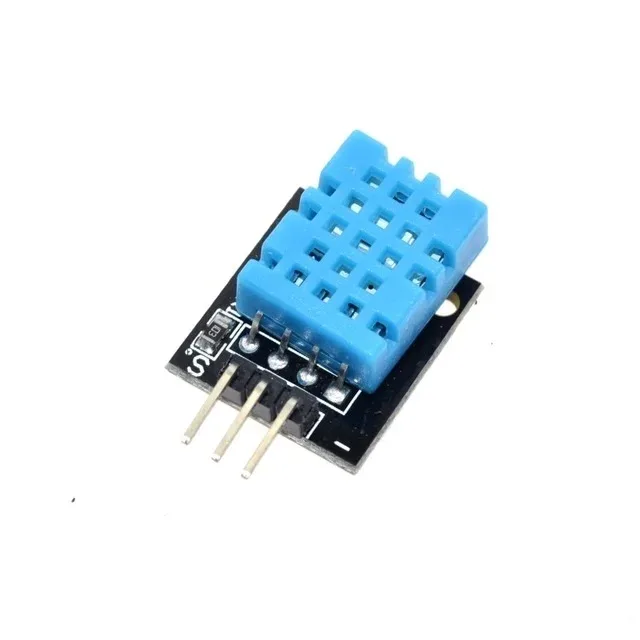
DHT11 Digital Relative Humidity and Temperature Sensor Module
Budget-friendly temperature and humidity sensor with single-wire interface, ideal for indoor monitoring projects with ESP32.

BMP280 Barometric Pressure and Altitude Sensor I2C/SPI Module
Add barometric pressure and altitude readings to your dashboard with this precise Bosch BMP280 breakout module.
3. Installing the Mosquitto MQTT Broker
The MQTT broker is the central hub that receives messages from the ESP32 and forwards them to subscribers. We will use Mosquitto, the most popular open-source broker. Install it on Ubuntu/Debian (Raspberry Pi OS included):
sudo apt update
sudo apt install mosquitto mosquitto-clients -y
sudo systemctl enable mosquitto
sudo systemctl start mosquitto
Test that the broker is running:
# Terminal 1 — subscribe
mosquitto_sub -h localhost -t "test/sensor"

# Terminal 2 — publish
mosquitto_pub -h localhost -t "test/sensor" -m "Hello MQTT"
You should see Hello MQTT appear in Terminal 1. Now note your machine’s local IP address using ip a or hostname -I — the ESP32 will connect to this IP.
By default, Mosquitto on modern versions requires a configuration file with listeners. Create one:
sudo nano /etc/mosquitto/conf.d/default.confPaste the following (for local network, no authentication — we will secure it later):
listener 1883
allow_anonymous true
Restart Mosquitto: sudo systemctl restart mosquitto
4. Installing Node-RED
Node-RED requires Node.js. The easiest way to install both on a Pi or Ubuntu server is the official script:
bash <(curl -sL https://raw.githubusercontent.com/node-red/linux-installers/master/deb/update-nodejs-and-nodered)After installation:
sudo systemctl enable nodered.service
sudo systemctl start nodered.service
Open a browser and navigate to http://<your-pi-ip>:1880. You should see the Node-RED editor. Next, install the dashboard package:
- Click the hamburger menu (top right) → Manage palette.
- Go to the Install tab.
- Search for
node-red-dashboardand click Install. - Also search for and install
node-red-contrib-ui-ledif you want status indicators.
The dashboard will be accessible at http://<your-pi-ip>:1880/ui.
5. ESP32 Arduino Firmware
Open the Arduino IDE. Make sure you have the ESP32 board package installed via Board Manager (URL: https://raw.githubusercontent.com/espressif/arduino-esp32/gh-pages/package_esp32_index.json).
Install these libraries via Library Manager:
- PubSubClient by Nick O’Leary — for MQTT
- DHT sensor library by Adafruit
- Adafruit Unified Sensor
Wire the DHT11 sensor: VCC → 3.3V, GND → GND, DATA → GPIO 4 (with a 10kΩ pull-up resistor to 3.3V).
Here is the complete firmware:
#include <WiFi.h>
#include <PubSubClient.h>
#include <DHT.h>
#include <ArduinoJson.h>

// --- Configuration ---
const char* WIFI_SSID     = "YourWiFiSSID";
const char* WIFI_PASSWORD = "YourWiFiPassword";
const char* MQTT_BROKER   = "192.168.1.100";  // your broker IP
const int   MQTT_PORT     = 1883;
const char* MQTT_TOPIC    = "home/sensors/esp32";
const char* CLIENT_ID     = "esp32-sensor-01";

#define DHTPIN  4
#define DHTTYPE DHT11

DHT dht(DHTPIN, DHTTYPE);
WiFiClient   wifiClient;
PubSubClient mqttClient(wifiClient);

void connectWiFi() {
  Serial.print("Connecting to WiFi");
  WiFi.begin(WIFI_SSID, WIFI_PASSWORD);
  while (WiFi.status() != WL_CONNECTED) {
    delay(500); Serial.print(".");
  }
  Serial.println("nWiFi connected: " + WiFi.localIP().toString());
}

void connectMQTT() {
  while (!mqttClient.connected()) {
    Serial.print("Connecting to MQTT...");
    if (mqttClient.connect(CLIENT_ID)) {
      Serial.println("connected!");
    } else {
      Serial.printf("failed (rc=%d), retrying in 5sn", mqttClient.state());
      delay(5000);
    }
  }
}

void setup() {
  Serial.begin(115200);
  dht.begin();
  connectWiFi();
  mqttClient.setServer(MQTT_BROKER, MQTT_PORT);
}

void loop() {
  if (!mqttClient.connected()) connectMQTT();
  mqttClient.loop();

  float temperature = dht.readTemperature();
  float humidity    = dht.readHumidity();

  if (isnan(temperature) || isnan(humidity)) {
    Serial.println("DHT read failed!");
    delay(2000);
    return;
  }

  // Build JSON payload
  StaticJsonDocument<128> doc;
  doc["temperature"] = temperature;
  doc["humidity"]    = humidity;
  doc["device"]      = CLIENT_ID;
  doc["uptime"]      = millis() / 1000;

  char payload[128];
  serializeJson(doc, payload);

  mqttClient.publish(MQTT_TOPIC, payload, true);  // retained
  Serial.printf("Published: %sn", payload);

  delay(5000);  // publish every 5 seconds
}
Upload the sketch. Open Serial Monitor at 115200 baud. You should see connection messages followed by Published: {"temperature":28.5,"humidity":62,...}.
6. Building the Node-RED Flow
Now switch to the Node-RED editor at http://<your-pi-ip>:1880 and build the following flow:
Step 1: MQTT In node
- Drag an mqtt in node onto the canvas.
- Double-click to configure. Click the pencil icon next to Server to create a new broker connection: Server =
localhost, Port =1883. Click Add. - Set Topic =
home/sensors/esp32, QoS = 1, Output = a parsed JSON object.
Step 2: JSON parse node
If the MQTT In node is not automatically parsing JSON, add a json node after it. Set Action to Always convert to JavaScript Object.
Step 3: Function node (extract fields)
Add a function node. Paste:
msg.temperature = msg.payload.temperature;
msg.humidity    = msg.payload.humidity;
msg.uptime      = msg.payload.uptime;
return msg;
Step 4: Dashboard nodes
- Add a ui_gauge node. Set Group = create a new group called “Sensors”, Label = Temperature, Units = °C, Range 0-50, Colour gradient: blue-green-red.
- Add another ui_gauge for Humidity: Label = Humidity, Units = %, Range 0-100.
- Add a ui_chart node. Type = Line chart, X-axis = last 30 minutes, Y-axis 0-100.
- Connect the function node output to all three dashboard nodes.
For the chart, you need separate messages. Add a change node before the chart that sets msg.payload = msg.temperature, and another for humidity with a different series label. Use a split/link approach for both series.
Step 5: Deploy
Click the red Deploy button. Navigate to http://<your-pi-ip>:1880/ui. You should see live gauges updating every 5 seconds!
7. Creating the Dashboard UI
Node-RED Dashboard (node-red-dashboard) offers these useful widgets for a sensor monitoring panel:
- Gauge: Circular or donut gauge — great for temperature and humidity at a glance.
- Chart: Line, bar, pie — plot historical trends. Configure X-axis for time-series.
- Text: Display raw values with custom formatting (e.g., last updated time).
- LED indicator: Green/red to show if sensor data is fresh (use a trigger node to set a flag if no data received in 30 seconds).
- Notification: Browser toast alerts when temperature crosses a threshold.
To organise widgets, use tabs and groups in the dashboard layout panel (click the grid icon in the Node-RED sidebar). You can have separate tabs for different rooms or sensor types.
Adding threshold alerts: Place a switch node after your function node. Configure rule: msg.temperature > 35 → output 1. Connect output 1 to a ui_notification node with a warning message. This pushes a browser alert whenever the room gets too hot — very useful for server rooms or plant monitoring in Indian summers.
8. Adding More Sensors
The real power of the MQTT + Node-RED combo becomes apparent when you add multiple ESP32 nodes around your home or office. Each device publishes to a different topic:
home/sensors/living-roomhome/sensors/server-roomhome/sensors/terrace
In Node-RED, add a separate mqtt in node for each topic (or use a wildcard topic home/sensors/# and route by topic name in a function node).
Consider adding these additional sensors to enrich your dashboard:

DHT20 SIP Packaged Temperature and Humidity Sensor
Upgraded DHT20 with I2C interface — no pull-up resistor needed, higher accuracy than DHT11/DHT22, perfect for professional dashboards.

GY-BME280-3.3 Precision Altimeter Atmospheric Pressure Sensor Module
Measure temperature, humidity AND barometric pressure in one module — great for weather station dashboards.
9. Securing Your MQTT Broker
Running an open broker on a local network is fine for home projects, but if you expose port 1883 to the internet you are asking for trouble. Here is how to add username/password authentication:
# Create password file
sudo mosquitto_passwd -c /etc/mosquitto/passwd esp32user
# Enter password when prompted
Update /etc/mosquitto/conf.d/default.conf:
listener 1883
allow_anonymous false
password_file /etc/mosquitto/passwd
In the ESP32 firmware, update the connect call:
mqttClient.connect(CLIENT_ID, "esp32user", "yourpassword")For remote access over the internet, add TLS/SSL to Mosquitto and use port 8883. Alternatively, use a managed MQTT cloud service like HiveMQ Cloud (free tier: 100 connections) or EMQX Cloud.
10. Troubleshooting Common Issues
| Problem | Likely Cause | Fix |
|---|---|---|
| ESP32 fails to connect to MQTT (rc=-2) | Broker IP wrong or firewall blocking port 1883 | Check broker IP with hostname -I; open port in UFW |
| DHT reads NaN | Missing pull-up resistor or wrong pin | Add 10kΩ between DATA and 3.3V; check wiring |
| Node-RED dashboard not updating | MQTT subscription topic mismatch | Verify topic string matches exactly (case-sensitive) |
| ESP32 disconnects from MQTT every few minutes | Keep-alive timeout; WiFi drops | Call mqttClient.loop() frequently; add WiFi reconnect logic |
| Node-RED crashes on Pi | Low RAM (Pi Zero) | Use Pi 3/4 or a full VPS; reduce chart history retention |
Frequently Asked Questions
Can I use this project without a Raspberry Pi?
Yes. You can run Mosquitto and Node-RED on any Windows, Mac, or Linux PC on the same network. There are also free cloud-hosted Node-RED instances and managed MQTT brokers available.
How many ESP32 nodes can a single Mosquitto broker handle?
Mosquitto can handle thousands of simultaneous connections on modest hardware. A Raspberry Pi 4 comfortably manages 1,000+ connections. For a home or office, you will never hit this limit.
Can I store sensor data in a database?
Absolutely. Node-RED has nodes for InfluxDB (node-red-contrib-influxdb), MySQL, MongoDB, and SQLite. InfluxDB + Grafana is a popular combo for long-term time-series data with beautiful graphs.
What is the maximum range of the ESP32 Wi-Fi?
In open space, ESP32 Wi-Fi reaches 80–150 metres. Inside a typical Indian apartment with walls, expect 20–40 metres. Use an external antenna module (like the IPEX version) or a Wi-Fi repeater for larger areas.
Can I access the dashboard remotely over the internet?
Yes. Use port forwarding on your router, or better yet, set up a reverse proxy with Nginx and a free Let’s Encrypt SSL certificate. Alternatively, use Cloudflare Tunnel (free) to securely expose the Node-RED UI without opening firewall ports.
Conclusion
You now have a fully functional ESP32 MQTT Node-RED sensor dashboard that collects temperature and humidity data, publishes it over MQTT, and visualises it in real time on a browser-based UI. This architecture scales effortlessly — add more ESP32 nodes for different rooms, add more sensor types, set up alerts, and even log data to a database for historical analysis.
The total cost of this project using components from Zbotic is under ₹800, making it one of the most affordable home monitoring solutions available in India. Grab your ESP32, sensors, and start building today!
Ready to Build Your IoT Dashboard?
Shop all ESP32 boards, sensors, and accessories at Zbotic — fast shipping across India.


Add comment