
Building a professional InfluxDB Grafana ESP32 time series IoT database stack is the gold standard for IoT data monitoring. While simple cloud services like ThingSpeak or Blynk are great for beginners, serious IoT projects demand a purpose-built time series database with powerful visualization. InfluxDB is a high-performance time series database designed specifically for IoT sensor data — it can store millions of data points efficiently and query them in milliseconds. Grafana is a world-class visualization platform that turns raw database records into beautiful, real-time dashboards. Together with ESP32, they form a complete, open-source IoT monitoring stack that rivals commercial solutions costing lakhs of rupees.
Why Use a Time Series Database for IoT?
General-purpose relational databases like MySQL are not designed for time series data. When you store sensor readings every 10 seconds, you quickly accumulate millions of rows. MySQL starts struggling with queries like “give me the average temperature over the last 7 days, grouped by hour” as data volumes grow. Disk usage also explodes because relational databases don’t compress repetitive numeric data efficiently.
InfluxDB is purpose-built for this workload. It compresses time series data using delta encoding and run-length encoding, achieving compression ratios of 10:1 or better on typical sensor data. Its query language (Flux or InfluxQL) has built-in aggregation functions — mean, median, percentile, derivative, cumulative sum — that are optimized for time-windowed queries. What takes MySQL minutes can be answered by InfluxDB in milliseconds.
The combination of InfluxDB + Grafana is used by major Indian IT companies, manufacturing firms, and research institutions to monitor everything from server performance to production line metrics. Setting this up yourself on a ₹800/month VPS gives you capabilities that commercial IoT platforms charge thousands of rupees per month for.
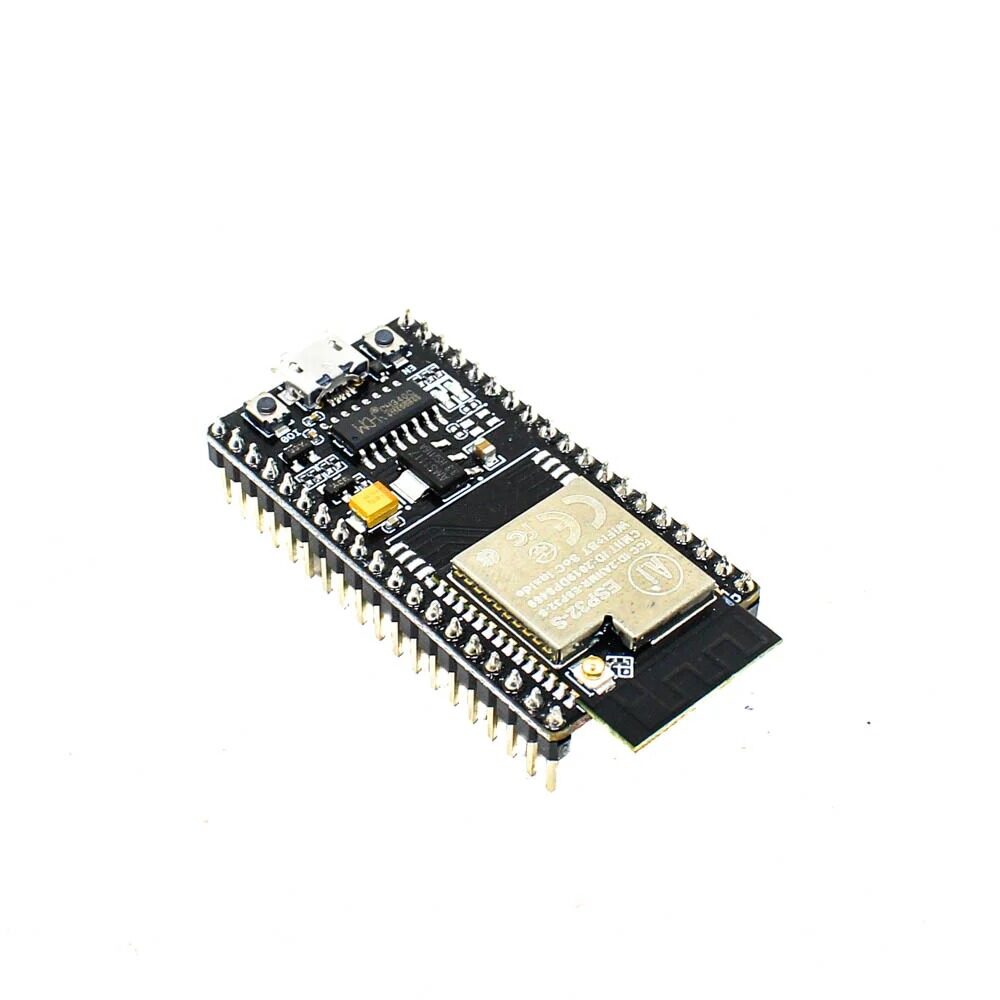
Ai Thinker NodeMCU-32S-ESP32 Development Board – IPEX Version
This full-featured ESP32 development board is the ideal data collection node — it sends sensor readings directly to InfluxDB over WiFi.
InfluxDB Overview: Key Concepts
Before jumping into setup, understand these core InfluxDB concepts:
Measurements
A measurement is analogous to a table in a relational database. For an IoT project, you might have measurements like temperature, humidity, pressure, or a single catch-all measurement like environment.
Tags
Tags are metadata attached to each data point. They are indexed and used for filtering. Examples: device=ESP32_Kitchen, location=Mumbai, floor=2. Tags allow you to query data for specific devices without scanning all records.
Fields
Fields are the actual measured values. They are not indexed. Examples: temperature=28.5, humidity=65.2. Fields store the numeric sensor readings.
Line Protocol
InfluxDB accepts data in Line Protocol format — a compact text-based format for writing data points:
measurement,tag1=val1,tag2=val2 field1=val1,field2=val2 timestamp

Example:
environment,device=ESP32_Kitchen,location=Mumbai temperature=28.5,humidity=65.2 1700000000000000000
Buckets and Retention Policies
InfluxDB v2 organizes data into buckets. Each bucket has a retention policy — data older than the retention period is automatically deleted. For example, a bucket with a 30-day retention period stores the last 30 days of sensor data and automatically discards older records, keeping disk usage bounded.
Grafana Overview: Dashboards and Panels
Grafana is an open-source visualization and analytics platform. It connects to InfluxDB (and dozens of other data sources) and presents data as panels arranged in dashboards. Each panel can be a time series graph, gauge, stat, table, heatmap, or map.
Key Grafana features for IoT projects:
- Alerting: Configure alerts when sensor values exceed thresholds. Grafana can send alerts via email, Telegram, Slack, or PagerDuty.
- Variables: Create dashboard variables to filter by device, location, or time period. A single dashboard with a device dropdown can show data for any of your ESP32 nodes.
- Annotations: Mark events on your time series graphs — power outages, firmware updates, maintenance events.
- Mobile access: Grafana dashboards are responsive and work on mobile browsers. You can monitor your IoT data from anywhere.
- Data transformation: Apply Flux transformations directly in Grafana panels — calculate moving averages, correlate multiple metrics, or convert units.
Server Setup: Installing InfluxDB and Grafana
You need a server to host InfluxDB and Grafana. Options for Indian makers:
- AWS Lightsail: ₹750/month for a 2GB RAM instance in Mumbai (ap-south-1)
- DigitalOcean: ₹700/month for a 2GB Droplet
- Raspberry Pi 4: Run the whole stack locally on your home network
- AWS EC2 (free tier): t2.micro free for 12 months — enough for testing
For a server running Ubuntu 22.04 LTS, install InfluxDB v2:
# Install InfluxDB 2.x
curl -s https://repos.influxdata.com/influxdata-archive_compat.key | gpg --dearmor | sudo tee /etc/apt/trusted.gpg.d/influxdata-archive_compat.gpg > /dev/null
echo 'deb [signed-by=/etc/apt/trusted.gpg.d/influxdata-archive_compat.gpg] https://repos.influxdata.com/debian stable main' | sudo tee /etc/apt/sources.list.d/influxdata.list
sudo apt-get update && sudo apt-get install influxdb2
sudo systemctl enable influxdb && sudo systemctl start influxdb

# Install Grafana
sudo apt-get install -y adduser libfontconfig1 musl
wget https://dl.grafana.com/oss/release/grafana_10.2.0_amd64.deb
sudo dpkg -i grafana_10.2.0_amd64.deb
sudo systemctl enable grafana-server && sudo systemctl start grafana-server
After installation, complete the InfluxDB initial setup through the web UI at http://your-server:8086. Create an organization, a bucket (e.g., iot-sensors with 30-day retention), and generate an API token. Write down the API token — you need it in the ESP32 code and in Grafana.
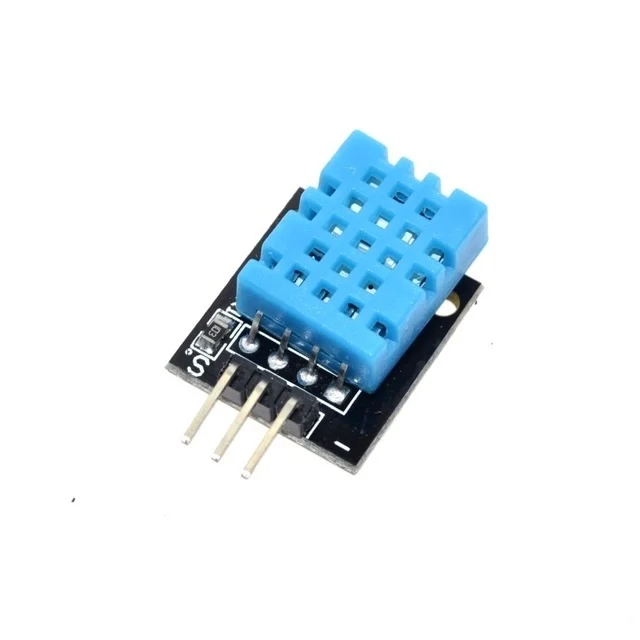
DHT11 Digital Relative Humidity and Temperature Sensor Module
A simple, reliable sensor to generate real IoT data for your InfluxDB + Grafana stack — reads temperature and humidity every few seconds from the ESP32.
ESP32 Code: Writing Data to InfluxDB
Espressif provides an official InfluxDB-Client-for-Arduino library available in the Arduino Library Manager. Install it and use this complete example:
#include <WiFi.h>
#include <InfluxDbClient.h>
#include <InfluxDbCloud.h>
#include <DHT.h>

#define WIFI_SSID       "YOUR_SSID"
#define WIFI_PASSWORD   "YOUR_PASSWORD"
#define INFLUXDB_URL    "http://your-server:8086"
#define INFLUXDB_TOKEN  "your-influxdb-api-token"
#define INFLUXDB_ORG    "your-org"
#define INFLUXDB_BUCKET "iot-sensors"
#define TZ_INFO         "IST-5:30"

#define DHTPIN 4
#define DHTTYPE DHT11
DHT dht(DHTPIN, DHTTYPE);

InfluxDBClient client(INFLUXDB_URL, INFLUXDB_ORG, INFLUXDB_BUCKET, INFLUXDB_TOKEN);
Point sensorData("environment");

void setup() {
  Serial.begin(115200);
  dht.begin();

  WiFi.begin(WIFI_SSID, WIFI_PASSWORD);
  while (WiFi.status() != WL_CONNECTED) { delay(500); }
  Serial.println("WiFi connected");

  // Sync time (required for accurate timestamps)
  timeSync(TZ_INFO, "pool.ntp.org", "time.google.com");

  // Add constant tags for this device
  sensorData.addTag("device", "ESP32_Kitchen");
  sensorData.addTag("location", "Mumbai");
  sensorData.addTag("floor", "1");

  // Verify connection
  if (client.validateConnection()) {
    Serial.println("Connected to InfluxDB: " + client.getServerUrl());
  } else {
    Serial.println("InfluxDB connection failed: " + client.getLastErrorMessage());
  }
}

void loop() {
  float temp = dht.readTemperature();
  float hum  = dht.readHumidity();

  if (!isnan(temp) && !isnan(hum)) {
    sensorData.clearFields();
    sensorData.addField("temperature", temp);
    sensorData.addField("humidity",    hum);
    sensorData.addField("heat_index",  dht.computeHeatIndex(temp, hum, false));

    if (!client.writePoint(sensorData)) {
      Serial.println("Write failed: " + client.getLastErrorMessage());
    } else {
      Serial.printf("Wrote: temp=%.1f hum=%.1fn", temp, hum);
    }
  }

  delay(10000); // Write every 10 seconds
}
The library handles batching, retry logic, and HTTP connection management automatically. It also uses NTP time synchronization to set accurate timestamps on each data point — this is crucial for time series data because InfluxDB uses timestamps for all queries.
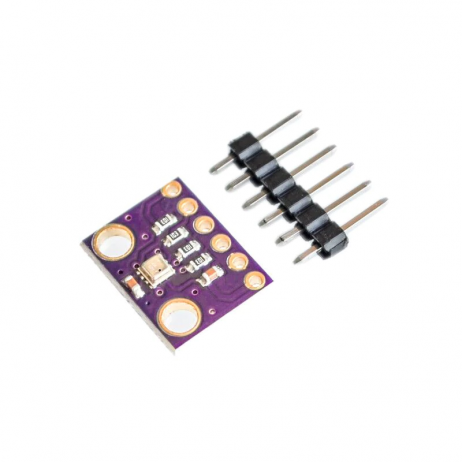
GY-BME280-3.3 Precision Altimeter Atmospheric Pressure Sensor Module
The BME280 gives you temperature, humidity, and pressure in one chip — triple the data fields to log in InfluxDB for comprehensive environmental monitoring.
Building a Grafana Dashboard
Access Grafana at http://your-server:3000 (default credentials: admin/admin). Follow these steps to create your first IoT dashboard:
Step 1: Add InfluxDB as a Data Source
Go to Connections → Data Sources → Add Data Source → InfluxDB. Set the query language to Flux. Enter your InfluxDB URL, organization, and API token. Click Save & Test — you should see a green success message.
Step 2: Create a New Dashboard
Click Dashboards → New Dashboard → Add Visualization. Select your InfluxDB data source. In the query editor, write a Flux query to retrieve your data:
from(bucket: "iot-sensors")
  |> range(start: v.timeRangeStart, stop: v.timeRangeStop)
  |> filter(fn: (r) => r._measurement == "environment")
  |> filter(fn: (r) => r._field == "temperature")
  |> filter(fn: (r) => r.device == "ESP32_Kitchen")
  |> aggregateWindow(every: v.windowPeriod, fn: mean, createEmpty: false)
  |> yield(name: "mean")
Step 3: Configure Panel Visualization
Select Time Series as the panel type. In the panel options, set the unit to Celsius (°C). Add a threshold at 35°C (colour it red). This visually highlights dangerous temperature conditions. Set the panel title to “Kitchen Temperature”.
Step 4: Add More Panels
Repeat for humidity, heat index, and any other sensors. Use the Stat panel type to show the latest current value. Use the Gauge panel for values with defined ranges (like humidity 0-100%). Arrange panels into a clean grid layout.
Step 5: Configure Alerts
In each panel, click Alert → New Alert Rule. Define a condition — for example, “if temperature is above 40°C for more than 5 minutes”. Configure a notification channel (email, Telegram bot, or webhook) to receive the alert. This turns your dashboard into a proactive monitoring system.
Production Tips for Indian Deployments
Running this stack reliably in Indian conditions requires some additional configuration:
Handle Power Outages
Power cuts are common across India. Configure your ESP32 to buffer sensor readings in RTC memory during outages and flush them to InfluxDB when connectivity is restored. Use the InfluxDB client’s batch write mode to send multiple points at once after reconnection.
Use IST Timezone Correctly
Always configure time sync with IST (UTC+5:30) timezone. The time sync code in the example above uses TZ_INFO = "IST-5:30". Grafana also needs to be configured to display times in IST — go to Profile → Preferences → Timezone → Asia/Kolkata.
Secure Your Stack
Put Nginx as a reverse proxy in front of both InfluxDB and Grafana. Issue a Let’s Encrypt SSL certificate. Disable direct access to ports 8086 and 3000 in your firewall. Enable Grafana’s built-in authentication and set strong passwords. If your ESP32 nodes send data from outside your home network, configure InfluxDB to require HTTPS.
Set Appropriate Retention Policies
Define two buckets: a raw bucket with 7-day retention for full-resolution data, and a downsampled bucket with 365-day retention that stores hourly averages. Use an InfluxDB task to automatically downsample from raw to hourly aggregates. This keeps your disk usage manageable for long-running deployments.
// InfluxDB Task: Downsample to 1-hour averages
option task = {name: "downsample_environment", every: 1h}

from(bucket: "iot-sensors")
  |> range(start: -task.every)
  |> filter(fn: (r) => r._measurement == "environment")
  |> aggregateWindow(every: 1h, fn: mean, createEmpty: false)
  |> to(bucket: "iot-sensors-archive", org: "your-org")
LM35 Temperature Sensors
The LM35 provides a linear analog voltage output proportional to temperature — great for logging precise temperature trends in InfluxDB from your ESP32’s ADC pin.
Frequently Asked Questions
Can I run InfluxDB and Grafana on a Raspberry Pi 4 at home?
Absolutely. A Raspberry Pi 4 with 4GB RAM running Ubuntu Server 22.04 handles InfluxDB and Grafana comfortably for home-scale projects. Use a fast SD card or, better, an SSD connected via USB 3.0 for InfluxDB’s write-intensive workload. The Pi draws only 5-7 Watts, making it economical to run 24/7. You’ll need a dynamic DNS service (like DuckDNS, free) and router port forwarding if you want to access your dashboard from outside your home network.
How many ESP32 nodes can one InfluxDB instance handle?
A properly configured InfluxDB instance on a 2GB VPS can easily handle 50-100 ESP32 nodes each writing every 10 seconds. InfluxDB is designed for high write throughput. For larger deployments, InfluxDB’s enterprise clustering handles millions of data points per second. For most Indian maker and small business deployments, a single instance on a modest VPS is more than sufficient.
Is InfluxDB free to use?
InfluxDB OSS (Open Source Software) is completely free to self-host, with no limits on data volume, retention, or the number of users. InfluxDB Cloud also has a free tier with 30-day data retention, which is useful for initial testing. For production use, self-hosting on an Indian VPS is the most cost-effective option — you pay only for the server, not per-metric or per-user fees.
What is the difference between InfluxDB v1 and v2?
InfluxDB v2 (released 2020) consolidates the database, Chronograf (UI), Kapacitor (task engine), and Telegraf agent into a single platform with a unified API. It uses Flux as the primary query language (replacing InfluxQL) and introduces buckets (replacing databases/retention policy combos) and organizations. If you’re starting fresh, use v2. InfluxQL still works in v2 for compatibility, but Flux is more powerful and is the recommended approach for new projects.
Can I use Grafana with sensors other than temperature?
Yes — Grafana is data-source agnostic and visualization-type agnostic. You can visualize any numeric data: soil moisture, water flow, electrical current, vibration frequency, GPS coordinates (on a map panel), machine counters, or custom binary state values. Any sensor readable by an ESP32 can have its data logged to InfluxDB and visualized in Grafana. Mix multiple sensor types in a single dashboard for a comprehensive facility monitoring view.
Build Your IoT Data Stack Today
Get the ESP32 boards, temperature sensors, and all the components you need for your InfluxDB + Grafana IoT project from Zbotic — India’s trusted electronics store with genuine products and fast shipping.


Add comment