
Sensors lie. Not intentionally — but a DHT11 spiking to 85°C on a 30°C day, an ultrasonic module returning 0 cm when nothing is blocking it, or a soil moisture sensor reading 100% in dry air: these are all real failure modes that plague embedded projects. Without anomaly detection built into your firmware, your data pipeline, alert system, or autonomous robot will make decisions based on garbage values.
This guide walks you through practical, memory-efficient sensor anomaly detection techniques you can implement directly on Arduino, ESP32, STM32, and other microcontrollers — no cloud required, no ML framework bloat. We cover statistical methods, time-series heuristics, and self-calibrating thresholds, all with working C++ code snippets.
Why Sensors Produce Anomalous Readings
Understanding the root cause of anomalies helps you choose the right detection method:
- Electrical noise: Long unshielded cables, PWM motors nearby, or poor PCB grounding inject spikes into ADC readings.
- Power supply droop: When a motor starts, VCC can dip momentarily, causing sensors to output incorrect values.
- Sensor self-heating: Resistive soil sensors heat up over time, drifting their readings upward.
- I2C/SPI bus errors: A corrupted byte returns a valid-looking but wrong value (e.g., 0x0000 or 0xFFFF cast to a float).
- Sensor aging / contamination: Gas sensors (MQ series) drift significantly as the heating element ages or the sensitive material gets contaminated.
- Physical interference: Ultrasonic sensors can get echoes from nearby walls; IR sensors saturate in sunlight.
- Firmware race conditions: Reading an ADC while a DMA transfer is in progress can produce stale or mixed data.
No single technique handles all of these. A well-designed firmware uses a layered approach — combining fast sanity checks with statistical filters applied over a rolling window.
Method 1: Hard-Limit Range Checks
The simplest and fastest check: reject any reading outside the physically possible range for the sensor. A temperature sensor that can physically read only −40°C to +125°C should never return 200°C. If it does, the reading is instantly invalid.
// Hard-limit check for LM35 (0-100°C typical operating range)
bool isValidTemperature(float tempC) {
  return (tempC >= -10.0f && tempC <= 120.0f);
}

float readTemperature() {
  int raw = analogRead(A0);
  float voltage = raw * (5.0f / 1023.0f);
  float tempC = voltage * 100.0f; // LM35: 10mV/°C
  if (!isValidTemperature(tempC)) {
    Serial.println("[ANOMALY] Temperature out of hard range");
    return NAN; // Signal invalid reading to caller
  }
  return tempC;
}
Always return NAN (Not a Number) rather than a sentinel like -999. The caller can use isnan() to detect failures without magic number comparisons.
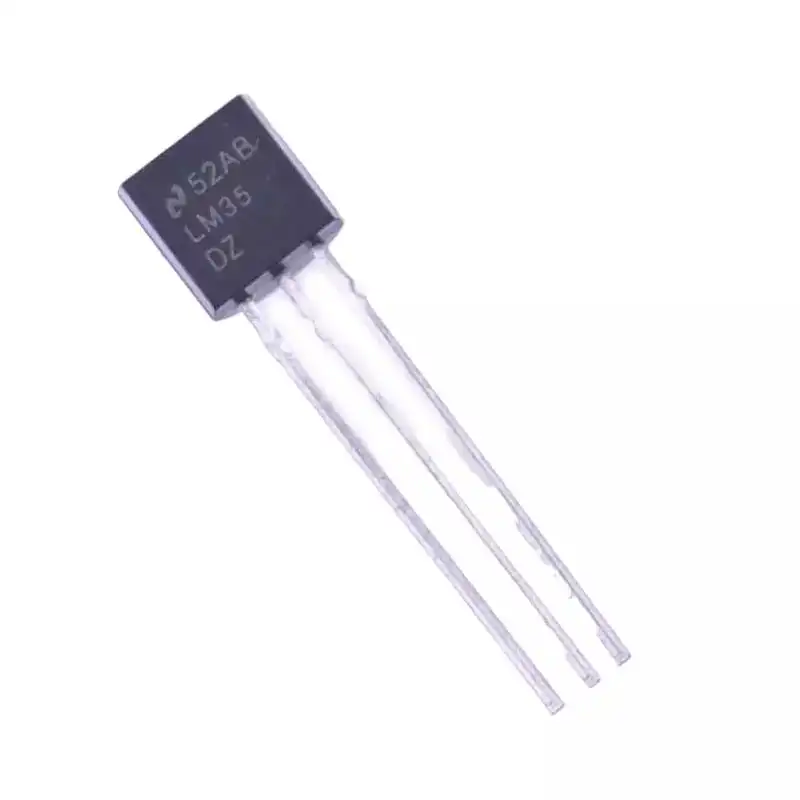
LM35 Temperature Sensors
Analog output makes LM35 ideal for demonstrating ADC noise and range anomalies on Arduino. Simple voltage-to-temperature conversion with predictable failure modes.
Method 2: Delta / Rate-of-Change Check
Even if a reading is within the physical range, it might be anomalous if it changed too fast. Real-world temperature doesn’t jump 15°C between two samples 500 ms apart. A sudden spike followed by a return to normal is a classic noise signature.
float lastTemp = NAN;
unsigned long lastReadTime = 0;

// Max physically plausible rate: 5°C per second
const float MAX_TEMP_DELTA_PER_SEC = 5.0f;

float readTempWithDeltaCheck() {
  float newTemp = rawReadTemp(); // your sensor read function
  unsigned long now = millis();

  if (!isnan(lastTemp) && lastReadTime > 0) {
    float dt = (now - lastReadTime) / 1000.0f; // seconds
    float delta = fabs(newTemp - lastTemp);
    float maxAllowedDelta = MAX_TEMP_DELTA_PER_SEC * dt;

    if (delta > maxAllowedDelta) {
      Serial.print("[ANOMALY] Delta too large: ");
      Serial.println(delta);
      return lastTemp; // Return last known good value
    }
  }
  lastTemp = newTemp;
  lastReadTime = now;
  return newTemp;
}
This technique requires storing the previous reading — trivial on any microcontroller but important to initialize correctly. On first boot, skip the delta check until you have at least one valid baseline reading.
Method 3: Moving Average Smoothing
A moving average doesn’t reject outliers but smooths them out. It works well when anomalies are infrequent and small. Use a circular buffer to keep the last N readings, then return the mean.
#define WINDOW_SIZE 8
float readings[WINDOW_SIZE];
int readIndex = 0;
bool bufferFull = false;

void addReading(float val) {
  readings[readIndex] = val;
  readIndex = (readIndex + 1) % WINDOW_SIZE;
  if (readIndex == 0) bufferFull = true;
}

float getMovingAverage() {
  int count = bufferFull ? WINDOW_SIZE : readIndex;
  if (count == 0) return NAN;
  float sum = 0;
  for (int i = 0; i < count; i++) sum += readings[i];
  return sum / count;
}
The limitation: a single large spike still shifts the mean. For a 8-sample window, one spike at 10× the normal value inflates the mean by ~10%. That’s acceptable for alerting with hysteresis (e.g., only alarm if average exceeds threshold) but bad for precise measurement.
Method 4: Z-Score Outlier Detection
The Z-score measures how many standard deviations a reading is from the mean of recent samples. A Z-score above 2.5–3.0 is statistically unusual and likely an outlier. This method adapts automatically to the sensor’s noise profile.
#define STATS_WINDOW 16
float statsBuffer[STATS_WINDOW];
int statsIdx = 0;
bool statsFull = false;

void addToStats(float val) {
  statsBuffer[statsIdx] = val;
  statsIdx = (statsIdx + 1) % STATS_WINDOW;
  if (statsIdx == 0) statsFull = true;
}

bool isZScoreAnomaly(float newVal, float zThreshold = 2.5f) {
  int count = statsFull ? STATS_WINDOW : statsIdx;
  if (count < 4) return false; // Need enough samples

  float sum = 0, sumSq = 0;
  for (int i = 0; i < count; i++) {
    sum += statsBuffer[i];
    sumSq += statsBuffer[i] * statsBuffer[i];
  }
  float mean = sum / count;
  float variance = (sumSq / count) - (mean * mean);
  float stdDev = sqrt(variance);

  if (stdDev < 0.001f) return false; // Avoid div by zero for stable sensors
  float zScore = fabs(newVal - mean) / stdDev;
  return (zScore > zThreshold);
}
Z-score detection is self-calibrating: as the sensor’s operating environment changes (e.g., temperature climbs slowly during the day), the mean and stddev update naturally, so gradual drift doesn’t trigger false positives. It only flags sudden jumps.
Method 5: IQR-Based Outlier Rejection
The Interquartile Range (IQR) method is more robust than Z-score when your data has a non-Gaussian distribution or heavy tails. Values below Q1 − 1.5×IQR or above Q3 + 1.5×IQR are flagged as outliers. On microcontrollers, computing exact quartiles requires sorting, so use a small window (8–16 samples).
#include <algorithm> // for std::sort in Arduino (available in C++11)

bool isIQRAnomaly(float newVal, float* window, int count) {
  if (count < 8) return false;

  float sorted[16]; // Copy to avoid modifying original
  memcpy(sorted, window, count * sizeof(float));
  std::sort(sorted, sorted + count);

  int q1idx = count / 4;
  int q3idx = (count * 3) / 4;
  float Q1 = sorted[q1idx];
  float Q3 = sorted[q3idx];
  float IQR = Q3 - Q1;

  float lower = Q1 - 1.5f * IQR;
  float upper = Q3 + 1.5f * IQR;

  return (newVal < lower || newVal > upper);
}
IQR works exceptionally well for sensors with occasional large spikes (ultrasonic range finders, ADC reads during motor startup). The 1.5× multiplier is the Tukey fence; you can increase it to 3.0× for a more relaxed threshold.
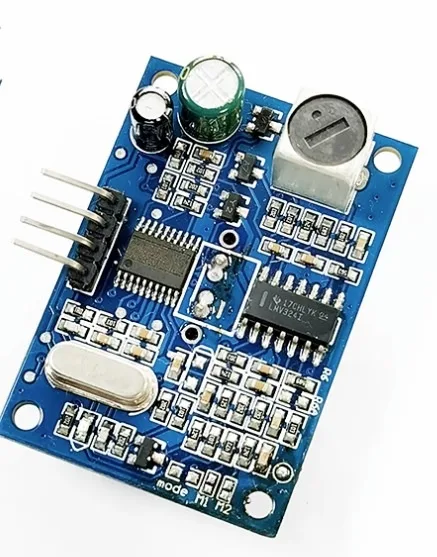
JSN-SR04T Waterproof Ultrasonic Rangefinder
Ultrasonic sensors are prone to spurious echoes — perfect for testing IQR and median filter anomaly rejection in real conditions.
Method 6: Median Filter (Most Robust)
For embedded systems, the median filter is often the best single technique for spike rejection. Unlike the mean, the median is completely immune to a single extreme outlier: in a window of 7 readings, one spike at 1000× the normal value will not affect the median at all, because it ranks last and the median is the 4th value.
// Efficient median of 5 (classic sorting network)
float median5(float a, float b, float c, float d, float e) {
  // Sorting network for 5 elements — only 9 comparisons
  #define SWAP(x,y) if((x)>(y)){float t=(x);(x)=(y);(y)=t;}
  SWAP(a,b); SWAP(d,e); SWAP(a,c); SWAP(b,c);
  SWAP(a,d); SWAP(c,d); SWAP(b,e); SWAP(b,c); SWAP(c,e);
  #undef SWAP
  return c; // Middle element is median
}

// Circular buffer approach for larger windows
#define MED_WIN 7
float medBuf[MED_WIN];
int medIdx = 0;
bool medFull = false;

float getMedianFiltered(float newVal) {
  medBuf[medIdx] = newVal;
  medIdx = (medIdx + 1) % MED_WIN;
  if (medIdx == 0) medFull = true;

  int count = medFull ? MED_WIN : medIdx;
  float sorted[MED_WIN];
  memcpy(sorted, medBuf, count * sizeof(float));
  // Simple insertion sort (fine for small N)
  for (int i = 1; i < count; i++) {
    float key = sorted[i];
    int j = i - 1;
    while (j >= 0 && sorted[j] > key) {
      sorted[j+1] = sorted[j];
      j--;
    }
    sorted[j+1] = key;
  }
  return sorted[count / 2];
}
The median filter does introduce latency: you need N/2 samples before the filter catches up to a real step change. For a 7-sample window at 10 Hz, that’s 350 ms of lag. For slow environmental sensors (temperature, humidity, air quality), this is perfectly acceptable. For fast-response applications (motor encoder feedback, collision detection), use a smaller window (3 or 5 samples).
Method 7: Sensor Health Scoring
Rather than binary valid/invalid, assign each sensor a continuous health score (0–100). The score decrements when anomalies are detected and recovers slowly when readings are consistent. Upstream logic can use the health score to weight sensor fusion or to decide when to raise a maintenance alert.
struct SensorHealth {
  float score;         // 0-100
  uint32_t anomalyCount;
  uint32_t totalReadings;
  float lastGoodValue;

  SensorHealth() : score(100.0f), anomalyCount(0), totalReadings(0), lastGoodValue(NAN) {}

  void recordReading(bool isAnomaly, float value) {
    totalReadings++;
    if (isAnomaly) {
      anomalyCount++;
      score = max(0.0f, score - 10.0f); // Penalise
    } else {
      score = min(100.0f, score + 0.5f); // Recover slowly
      lastGoodValue = value;
    }
  }

  bool isHealthy() const { return score > 60.0f; }
  float anomalyRate() const {
    return totalReadings ? (float)anomalyCount / totalReadings * 100.0f : 0;
  }
};

SensorHealth tempHealth;
Log the health score periodically via serial or MQTT. An anomaly rate above 5% on a sensor that has been running for hours usually signals a hardware problem: loose wire, condensation, failing component. This is the foundation of predictive maintenance in embedded IoT systems.
Combining Methods in a Pipeline
In production firmware, chain the methods: fast checks first (hard limits, delta), then statistical filters (median or Z-score) for the filtered value, then update the health score. Here’s a complete integration pattern:
float readSensorSafe() {
  float raw = readRawSensor(); // Read hardware

  // Stage 1: Hard limits
  if (!isValidRange(raw)) {
    tempHealth.recordReading(true, raw);
    return tempHealth.lastGoodValue; // Use last known good
  }

  // Stage 2: Delta check
  if (isDeltaAnomaly(raw)) {
    tempHealth.recordReading(true, raw);
    return tempHealth.lastGoodValue;
  }

  // Stage 3: Median filter (implicit anomaly rejection)
  float filtered = getMedianFiltered(raw);

  // Stage 4: Z-score on filtered value
  bool isOutlier = isZScoreAnomaly(filtered);
  tempHealth.recordReading(isOutlier, filtered);
  addToStats(filtered); // Update stats window with clean value

  return isOutlier ? tempHealth.lastGoodValue : filtered;
}
A few important design notes:
- Never block on anomaly detection. Return the last good value, not zero or a magic number. Returning 0 can trigger false emergency shutdowns in motor controllers or irrigation systems.
- Log anomalies to EEPROM or SPIFFS with a timestamp if your application requires audit trails.
- Calibrate thresholds per sensor type. A DHT11 with ±2°C accuracy needs looser thresholds than a DS18B20 with ±0.5°C.
- Handle NaN propagation. If you pass NaN values through arithmetic, you get NaN results silently. Always check
isnan()before using a sensor value in calculations.
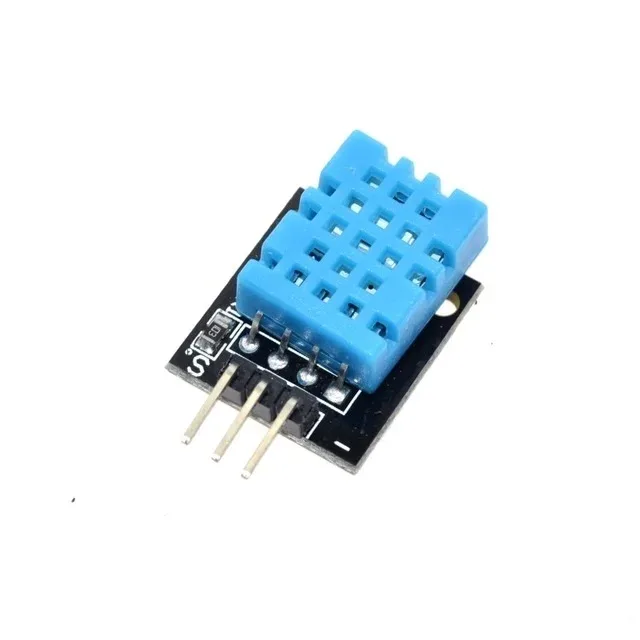
DHT11 Temperature and Humidity Sensor Module
The DHT11 is notorious for occasional invalid reads (returning 0% humidity or 0°C) — ideal for testing your anomaly detection pipeline in real hardware.

BMP280 Barometric Pressure and Altitude Sensor
High-precision I2C sensor — use it to study bus error anomalies and validate delta checks on fast-changing altitude data in drone applications.
Recommended Sensors for Anomaly Experiments
If you want to build a hands-on anomaly detection testbed, these sensors each exhibit distinct failure modes that stress-test different detection methods:
- LM35: Analog output, sensitive to power noise — great for testing hard limits and Z-score on ADC data.
- DHT11/DHT20: Known for occasional checksum-failing reads that return 0 values — hard limit and delta checks handle these well.
- DS18B20: OneWire bus occasionally returns 85°C (power-on reset value) — a classic hard-limit false positive to filter.
- BMP280/BME280: I2C bus errors return 0 Pa pressure — combine with health scoring to detect intermittent connection issues.
- JSN-SR04T: Spurious echoes return 0 or very small distances — IQR and median filters shine here.
- MQ-135: Warm-up drift during the first 24-48 hours of operation — Z-score with a slow-updating baseline handles this well.
FAQ
What is the best anomaly detection method for Arduino?
For most projects, a median filter (window size 5–7) combined with hard-limit range checks covers 95% of real-world anomalies with minimal RAM usage. Add Z-score detection if you need to catch gradual drift as well as spikes.
How much RAM does anomaly detection use on an Arduino Uno?
A 7-sample float window uses 28 bytes. All methods described here, combined, fit in under 200 bytes of RAM — suitable even for the ATmega328P’s 2KB of SRAM.
Can I use machine learning for sensor anomaly detection on Arduino?
Yes — TensorFlow Lite Micro runs on ESP32 and Arduino Nano 33 BLE Sense. However, for sensor anomaly detection, statistical methods almost always outperform simple ML models because they’re self-calibrating, require zero training data, and run in microseconds.
What should I do when an anomaly is detected?
Best practice: return the last known good value, increment the anomaly counter, and log the event. Only trigger a system alarm if the anomaly rate exceeds a threshold (e.g., 3 anomalies in the last 10 readings). This avoids nuisance alarms from single glitches.
How do I tune the Z-score threshold?
Start with a threshold of 3.0. If you get too many false positives in your specific environment, raise it to 3.5. If real anomalies are being missed, lower it to 2.5. Collect 5-10 minutes of baseline data first so the stats window is fully populated before enabling detection.
Does anomaly detection work on filtered sensor data or raw data?
Apply hard limits and delta checks on raw data (catches hardware faults immediately). Apply Z-score and IQR on moving-average-filtered data to detect environmental drift rather than single-sample spikes. The two-stage pipeline catches both types of anomalies.
Browse our full range of temperature, pressure, ultrasonic, and gas sensors at Zbotic Sensors & Modules. All sensors ship from Mumbai with fast Pan-India delivery. Build the anomaly detection firmware described in this guide and get reliable readings from day one.


Add comment