
Node-RED dashboard ESP32 sensor data local visualisation is one of the most powerful combinations available to Indian IoT makers today. Instead of depending on expensive cloud subscriptions or sending your private sensor data to servers abroad, you can build a beautiful, real-time dashboard that runs entirely on your local network — on a Raspberry Pi, an old laptop, or even the ESP32 itself using a small Node.js server. This complete tutorial walks you through every step, from installing Node-RED to building multi-panel dashboards with gauges, charts, and alerts.
What is Node-RED and Why Use It Locally?
Node-RED is an open-source, browser-based visual programming tool developed by IBM and now maintained by the Node-RED project under the OpenJS Foundation. It provides a drag-and-drop flow editor where you connect “nodes” to wire together data sources, processing logic, and outputs — no heavy coding required.
Why run Node-RED locally instead of using cloud dashboards (like ThingSpeak or Blynk)?
- Privacy: Your sensor data never leaves your premises — critical for home automation, medical monitoring, and industrial applications
- Speed: Local MQTT broker + Node-RED responds in milliseconds. Cloud round-trips can add 200–2000 ms latency
- No subscription cost: Free, forever — no limits on data points, update frequency, or number of devices
- Works offline: No internet dependency — keeps working during BSNL/Jio/Airtel outages
- Full customisation: Every aspect of the dashboard is configurable
The typical local IoT stack for Indian makers combines: ESP32 (sensor node) → Mosquitto MQTT broker → Node-RED (flow processing) → Node-RED Dashboard (browser UI). All running on a Raspberry Pi 4 or a small Ubuntu server.

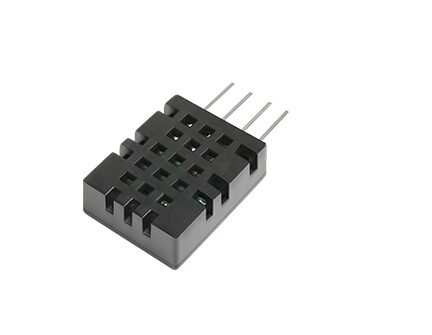
DHT11 Temperature And Humidity Sensor Module with LED
This plug-and-play DHT11 module is perfect for your first Node-RED dashboard project — connect to ESP32 and visualise live temperature and humidity data locally.
Installing Node-RED on Raspberry Pi / Ubuntu
Node-RED runs on any system with Node.js 18+. Here are installation commands for the most common setups used by Indian makers:
Raspberry Pi (Recommended: Raspberry Pi 4, 2GB RAM)
# Official Node-RED install script for Raspberry Pi
bash <(curl -sL https://raw.githubusercontent.com/node-red/linux-installers/master/deb/update-nodejs-and-nodered)

# Enable autostart on boot
sudo systemctl enable nodered.service
sudo systemctl start nodered.service
Ubuntu / Debian Server
# Install Node.js 20 LTS
curl -fsSL https://deb.nodesource.com/setup_20.x | sudo -E bash -
sudo apt-get install -y nodejs

# Install Node-RED globally
sudo npm install -g --unsafe-perm node-red

# Run as service
npx pm2 start node-red
npx pm2 startup
npx pm2 save
Access the Node-RED editor at http://YOUR_PI_IP:1880 from any browser on your local network.
Install the Dashboard and MQTT Nodes
# From Node-RED editor: Menu → Manage palette → Install
# Or via npm:
cd ~/.node-red
npm install node-red-dashboard
# Dashboard UI available at http://YOUR_PI_IP:1880/ui
Also install Mosquitto on the same machine to serve as your local MQTT broker:
sudo apt install mosquitto mosquitto-clients
sudo systemctl enable mosquitto
sudo systemctl start mosquitto
Programming ESP32 as an MQTT Sensor Publisher
The ESP32 will read sensor data and publish it to the local Mosquitto broker as JSON. Install the PubSubClient and DHT sensor library via Arduino Library Manager.
#include <WiFi.h>
#include <PubSubClient.h>
#include <DHT.h>
#include <ArduinoJson.h>

#define DHT_PIN  4
#define DHT_TYPE DHT11

const char* ssid     = "YourWiFi";
const char* password = "YourPass";
const char* broker   = "192.168.1.100"; // Raspberry Pi IP
const int   port     = 1883;

DHT dht(DHT_PIN, DHT_TYPE);
WiFiClient client;
PubSubClient mqtt(client);

void setup() {
  Serial.begin(115200);
  dht.begin();
  WiFi.begin(ssid, password);
  while (WiFi.status() != WL_CONNECTED) delay(500);
  mqtt.setServer(broker, port);
}

void loop() {
  if (!mqtt.connected()) {
    mqtt.connect("esp32-sensor-node");
  }
  mqtt.loop();

  static unsigned long lastSend = 0;
  if (millis() - lastSend > 5000) {
    lastSend = millis();
    float temp = dht.readTemperature();
    float hum  = dht.readHumidity();

    if (!isnan(temp) && !isnan(hum)) {
      StaticJsonDocument<128> doc;
      doc["temperature"] = temp;
      doc["humidity"]    = hum;
      doc["device"]      = "esp32-node-1";

      char buf[128];
      serializeJson(doc, buf);
      mqtt.publish("home/sensors/dht11", buf);
      Serial.println(buf);
    }
  }
}
Building the Node-RED MQTT Subscriber Flow
Open Node-RED at http://YOUR_PI_IP:1880 and create the following flow:
- MQTT In node: Double-click to configure. Set Server to
localhost:1883, Topic tohome/sensors/dht11, QoS 0, Output: parsed JSON object. - JSON node: Connect after MQTT In. Set Action to “Always convert to JavaScript Object” — this parses the incoming JSON string.
- Function node (optional): Extract specific fields and add calculated data:
// Function node: Process sensor data
var data = msg.payload;

// Add heat index calculation
var T = data.temperature;
var H = data.humidity;
data.heatIndex = -8.78469 + 1.61139 * T + 2.3385 * H
               - 0.14612 * T * H - 0.01230 * T * T
               - 0.01642 * H * H;
data.heatIndex = Math.round(data.heatIndex * 10) / 10;
data.timestamp = new Date().toLocaleTimeString('en-IN');

msg.payload = data;
return msg;
Connect the output to multiple dashboard nodes in parallel (fan-out) by wiring from the same output port to multiple destination nodes.
DHT20 SIP Packaged Temperature and Humidity Sensor
Upgrade your Node-RED project with the DHT20 — I2C interface, ±0.5°C accuracy, and SIP packaging for reliable long-term monitoring in your local dashboard setup.
Creating the Dashboard: Gauges, Charts and Text Displays
With node-red-dashboard installed, you have access to these UI nodes: gauge, chart, text, slider, switch, button, form, notification, and more.
Temperature Gauge
Drag a gauge node from the dashboard palette. Configure it:
- Group: Create a new group called “Climate Monitor” under a new tab “Home Sensors”
- Label: Temperature
- Value format:
{{value}} °C - Range: min 0, max 50
- Sectors: 0-20 (blue/cold), 20-35 (green/normal), 35-50 (red/hot)
Connect to the Function node output. In the function node, set msg.payload = data.temperature for this specific output wire. Use a Change node to set msg.payload to msg.payload.temperature for cleaner flow design.
Historical Chart
Drag a chart node and configure:
- Type: Line chart
- X-axis: Last 1 hour
- Y-axis: 0–50
- Series: Temperature + Humidity (use two lines on same chart)
For multiple series, send a structured payload:
// Function node for chart (dual series)
msg.payload = [
  { "series": "Temperature", "data": [{ "x": Date.now(), "y": msg.payload.temperature }] },
  { "series": "Humidity",    "data": [{ "x": Date.now(), "y": msg.payload.humidity }] }
];
return msg;
Adding Alerts and Automation Rules
Node-RED excels at combining sensor data with logic rules. Here are practical alert examples:
High Temperature Alert (Email or MQTT command)
// Switch node: check temperature > 35
// Property: msg.payload.temperature
// Rule 1: > 35 → wire to notification node + MQTT Out (turn on fan)
// Rule 2: otherwise → wire to nothing (or log)

// MQTT Out node config:
// Topic: home/commands/fan
// Payload: "ON"
Add a notification node (from dashboard palette) to show a pop-up on the dashboard browser, or use the node-red-node-email package to send Gmail alerts when temperature exceeds threshold.
Data Logging to CSV
// Function node: format CSV row
var d = msg.payload;
msg.payload = new Date().toISOString() + ","
            + d.temperature + "," + d.humidity + "n";
return msg;
// Connect to: File node → /home/pi/sensor-log.csv (append)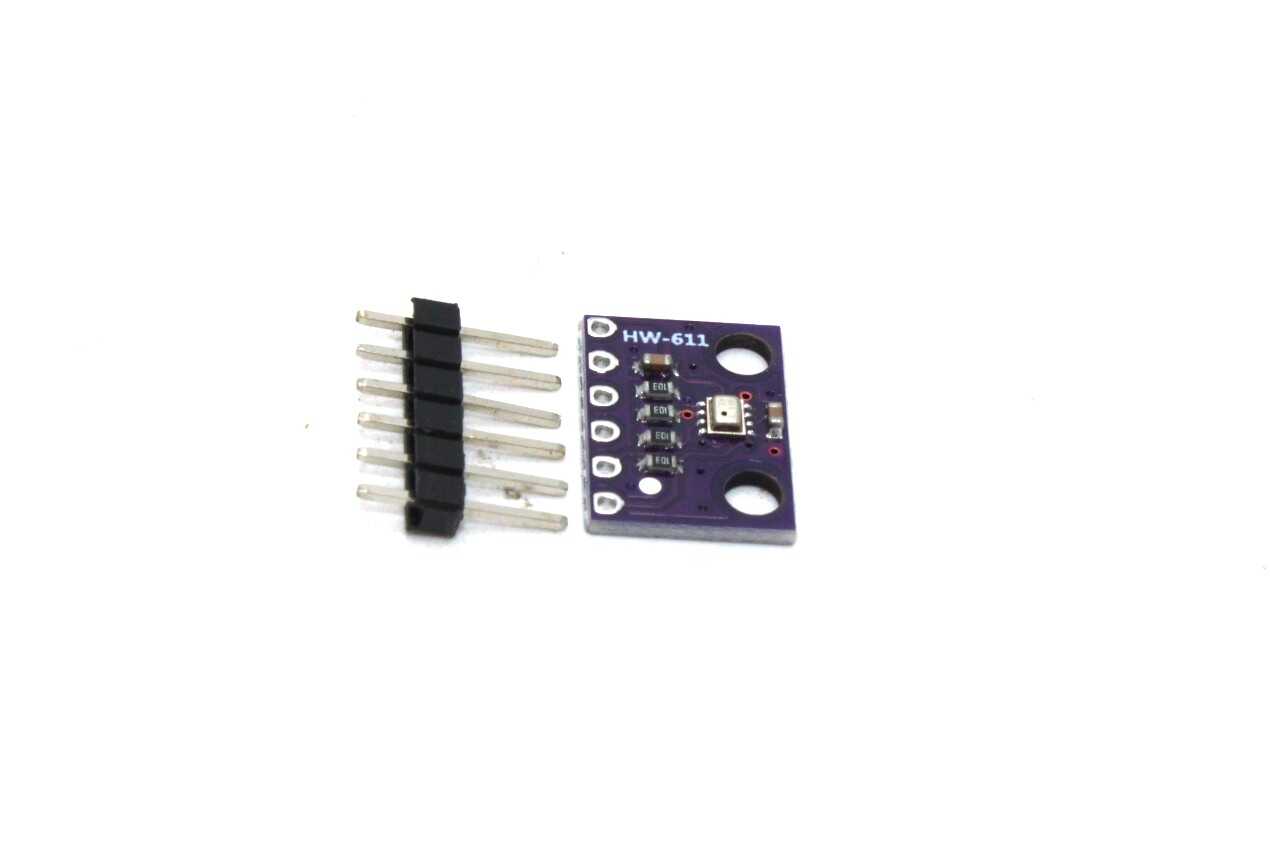
BMP280 Barometric Pressure and Altitude Sensor I2C/SPI Module
Add altitude and barometric pressure data to your Node-RED multi-sensor dashboard. The BMP280 connects easily to ESP32 via I2C for a comprehensive weather station.
Multi-Sensor Dashboard: Temperature, Humidity and Pressure
Once your single-sensor flow is working, expanding to a multi-sensor dashboard is straightforward. Add a BME280 (temperature + humidity + pressure) to your ESP32 and publish all three values in a single JSON packet:
#include <Adafruit_BME280.h>
Adafruit_BME280 bme;

// In loop():
StaticJsonDocument<256> doc;
doc["temperature"] = bme.readTemperature();
doc["humidity"]    = bme.readHumidity();
doc["pressure"]    = bme.readPressure() / 100.0F; // hPa
doc["altitude"]    = bme.readAltitude(1013.25);    // Sea level hPa
doc["device"]      = "esp32-weather-1";
char buf[256];
serializeJson(doc, buf);
mqtt.publish("home/sensors/weather", buf);
In Node-RED, create separate Change nodes to extract each field and connect each to its own gauge, chart, or text widget on the dashboard. Organise the dashboard with tabs for different rooms or sensor types. You can have 10+ ESP32 nodes all publishing to different MQTT topics and a single Node-RED instance visualising all of them simultaneously.
For deploying to multiple devices across your home or office in India, assign static local IPs to each ESP32 in your router’s DHCP settings, and use device-specific MQTT topic paths like home/room1/sensors, home/room2/sensors, etc.
Frequently Asked Questions
Can Node-RED run on an ESP32 directly?
No. Node-RED is a Node.js application and requires significantly more RAM than the ESP32’s 512 KB – 8 MB provides. Node-RED runs on the server side (Raspberry Pi, PC, or cloud VM), while the ESP32 acts as the sensor/actuator node publishing data via MQTT. The minimum practical hardware for running Node-RED is a Raspberry Pi Zero 2W (512 MB RAM) or any Linux system with 256+ MB RAM.
How do I access my Node-RED dashboard from outside my home network?
Several options: (1) Use Ngrok or Cloudflare Tunnel to expose Node-RED temporarily for remote access. (2) Set up a WireGuard or OpenVPN server on your Raspberry Pi so you can VPN into your home network. (3) Use the Node-RED Projects feature with Node-RED Cloud managed hosting. Never expose port 1880 directly to the internet without setting up authentication — go to Node-RED Settings → Security and configure a username/password.
What is the difference between MQTT QoS 0, 1, and 2 in Node-RED?
QoS 0 (at most once) — fire and forget, no acknowledgement. Best for frequent sensor readings where losing an occasional message is acceptable. QoS 1 (at least once) — broker acknowledges receipt; message may be delivered more than once. Good for important data. QoS 2 (exactly once) — four-way handshake ensures delivery exactly once. Slowest but used for critical commands like actuator control. For ESP32 sensor data flowing into Node-RED dashboards, QoS 0 is usually sufficient.
How do I persist Node-RED dashboard data across restarts?
By default, chart history and UI state are lost when Node-RED restarts. To persist data: (1) Use the node-red-contrib-influxdb node to store data in InfluxDB time-series database. (2) Use Node-RED’s built-in context storage with file-backed persistence (configure in settings.js). (3) For simple cases, a File write node to CSV works. InfluxDB + Grafana is the enterprise-grade stack for long-term IoT data visualisation.
Get Started with Your IoT Dashboard Today
Shop ESP32 development boards, DHT sensors, BME280, and all the components you need to build your local Node-RED IoT monitoring system. Fast delivery across India from Zbotic.


Add comment