
The oscilloscope is arguably the single most powerful tool in an electronics engineer’s or hobbyist’s arsenal. If you have ever stared at a screen full of wavy lines and felt completely lost, you are not alone. This oscilloscope basics tutorial is written specifically for beginners — starting from absolute zero and building up to confidently reading waveforms, diagnosing circuit problems, and measuring signal parameters. By the end of this guide, your oscilloscope will go from intimidating to indispensable.
What Is an Oscilloscope and What Does It Do?
An oscilloscope is an electronic instrument that graphically displays voltage signals over time. Think of it as a voltmeter on steroids — instead of showing just one voltage number at a snapshot in time, an oscilloscope draws the complete story of how a voltage changes every microsecond (or nanosecond), revealing the shape, frequency, amplitude, timing, and hidden details of electrical signals that are completely invisible to a multimeter.
A multimeter can tell you a circuit has “5V” on a pin. An oscilloscope can show you that the “5V” is actually a noisy signal swinging between 4.5V and 5.5V at 100MHz, or that it has a 200mV spike every time a relay clicks, or that a PWM signal has its duty cycle changing erratically. These are the kinds of insights that separate experienced engineers from beginners — and they are all revealed by an oscilloscope.
Analog vs Digital Oscilloscopes
All modern oscilloscopes sold today are DSOs (Digital Storage Oscilloscopes). They sample the input signal at high speed (50 Megasamples/second to 5 Gigasamples/second), store it digitally, and display it on an LCD screen. Budget DSOs (₹4,000–₹15,000) like the DS1054Z, OWON SDS1202, or Hantek DSO5072P are excellent for Arduino, sensor, and audio work up to 50–200MHz bandwidth. For serious power electronics or RF work, professional Tektronix or Keysight scopes are used, but these are out of reach for most hobbyists.
Understanding the Key Controls
The front panel of an oscilloscope can look overwhelming at first, but it is organised into three logical sections. Once you understand this structure, everything makes sense.
1. Vertical Section (Amplitude / Voltage)
This controls the voltage scale of the display. The key control is Volts/Div (usually a rotary knob or soft-key menu). This sets how many volts each vertical division (the horizontal lines on the screen grid) represents. The oscilloscope screen is typically 8 divisions tall. So if you set Volts/Div to 1V, the screen shows ±4V (8 divisions × 1V/div). If you set it to 5V/div, you can see ±20V.
Rule of thumb: Set the volts/div so the signal occupies about 4–6 of the 8 vertical divisions. If the signal is too small (less than 2 divisions tall), decrease volts/div. If it is clipped (hitting the top or bottom of the screen), increase volts/div.
The vertical position knob shifts the waveform up and down on screen. Use it to centre the waveform.
2. Horizontal Section (Time / Frequency)
This controls how time is displayed. The key control is Time/Div (or Sec/Div). This sets how many seconds (or milliseconds, or microseconds) each horizontal division represents. The screen is typically 10 divisions wide. So if you set Time/Div to 1ms, you see 10ms of signal history on screen. At 1µs/div, you see 10µs — good for looking at the detailed switching behaviour of a MOSFET.
Rule of thumb: Set the time/div so you can see 2–5 complete cycles of the signal. If you are looking at a 50Hz mains waveform (period = 20ms), set time/div to 2ms to see 2 complete cycles clearly.
3. Trigger Section (Synchronisation)
The trigger is what makes the waveform appear “frozen” on screen. Without triggering, the scope would display a constantly scrolling signal and you would see nothing but blur. The trigger tells the scope: “Start drawing the waveform when the signal crosses this voltage level in this direction.” We will cover this in detail in its own section.
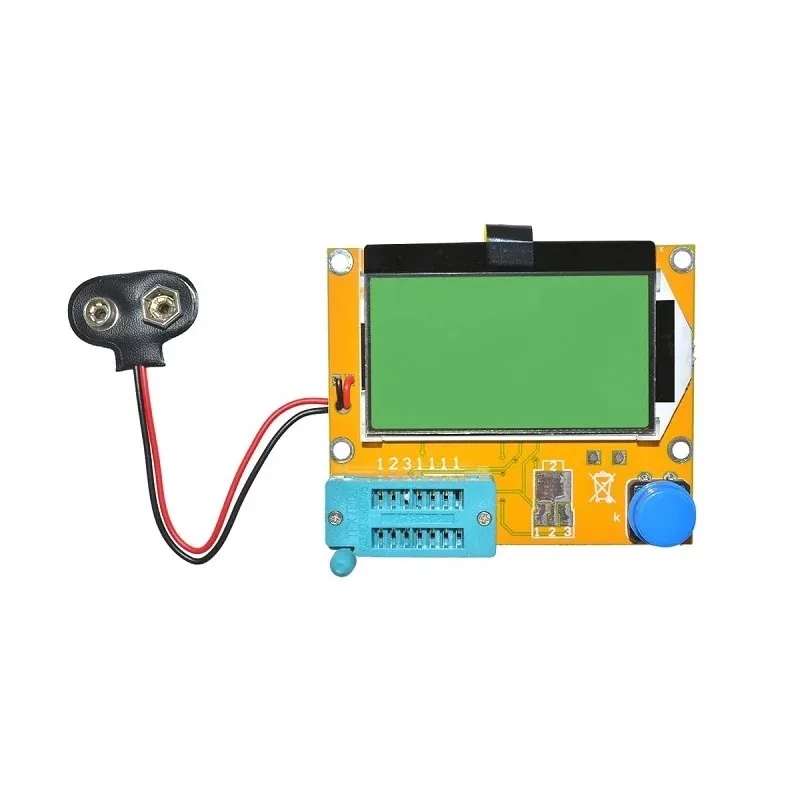
LCR-T4 LCD Graphical Transistor Tester – Capacitance, ESR, SCR Meter
Before using your oscilloscope, verify component values with this LCR-T4 tester. It identifies transistors, measures capacitance, ESR, and more — an excellent companion test instrument.
Oscilloscope Probes: Setup and Compensation
The probe is the interface between your circuit and the oscilloscope, and it is the source of many beginners’ measurement errors. Understanding probe settings is critical to getting accurate measurements.
1× vs 10× Probes
Most oscilloscopes come with probes that have a 1×/10× switch on the probe body. This is one of the most misunderstood controls for beginners.
- 1× mode: The probe connects the signal directly to the oscilloscope input with no attenuation. The scope displays the true signal amplitude. However, the probe cable has significant capacitance (100–200pF) which acts as a low-pass filter and distorts high-frequency signals above ~1–2MHz.
- 10× mode: The probe contains a 9MΩ resistor in series, creating a 10:1 voltage divider with the oscilloscope’s 1MΩ input impedance. The signal displayed on screen is 1/10th of the actual signal, so you must multiply the reading by 10 (or tell the oscilloscope the probe ratio in the menu so it does this automatically). The advantage: probe capacitance drops to ~15pF, allowing accurate measurement up to 100MHz or more.
Rule of thumb: Always use 10× probes for frequencies above 100kHz. Use 1× only for very slow, low-amplitude signals where the extra sensitivity is needed.
Probe Compensation
This is the step beginners most often skip, and it leads to inaccurate measurements. Every oscilloscope has a square wave calibration output (usually labelled “CAL” or “COMP”, 1kHz, 1Vpp). To compensate your probe:
- Connect the probe tip to the calibration output and the ground clip to the oscilloscope’s ground reference
- Set the oscilloscope to 1V/div and 0.5ms/div
- You should see a square wave. If the corners are rounded (undercompensated) or show sharp spikes (overcompensated), adjust the small trimmer capacitor on the probe (usually a small yellow or white plastic screw accessible near the probe BNC connector) with a plastic screwdriver until the square wave corners are sharp and flat
- Repeat for each probe separately — probes are individually compensated for each scope input
How to Read Waveforms: Voltage, Time, and Frequency
Now for the core skill: extracting meaningful measurements from what you see on screen.
Measuring Voltage
- Peak-to-peak voltage (Vpp): The total voltage swing from the lowest point to the highest point of the waveform. Count the number of vertical divisions between the peak and trough, then multiply by Volts/Div. Example: 3 divisions × 2V/div = 6Vpp.
- Peak voltage (Vpeak): The highest voltage from the zero line (0V). For a symmetric AC signal, Vpeak = Vpp / 2.
- RMS voltage (Vrms): The equivalent DC voltage in terms of power. For a pure sine wave, Vrms = Vpeak / √2 ≈ Vpeak × 0.707. This is what your multimeter reads in AC mode. Your oscilloscope may calculate and display this automatically in the measurement menu.
- DC offset: How far the centre of the waveform is from 0V. Set the scope to AC coupling to remove the DC offset and see just the AC component.
Measuring Time and Frequency
- Period (T): The time for one complete cycle of a repetitive waveform. Count the horizontal divisions for one full cycle (from rising edge to the next rising edge) and multiply by Time/Div. Example: 4 divisions × 0.5ms/div = 2ms period.
- Frequency (f): f = 1/T. For a 2ms period: f = 1/0.002 = 500Hz.
- Pulse width: The time the signal is high (or low) for a single pulse or PWM signal. Count horizontal divisions during the high period.
- Duty cycle: Duty cycle = (Pulse width / Period) × 100%. For a PWM signal with a 1ms high time and 2ms period: duty cycle = 50%.
Modern digital oscilloscopes calculate all of these automatically. Press the “Measure” button and select which parameters you want displayed as on-screen overlays. Always verify automatic measurements against manual counting for critical measurements — automated measurements can be fooled by noisy or unusual waveforms.
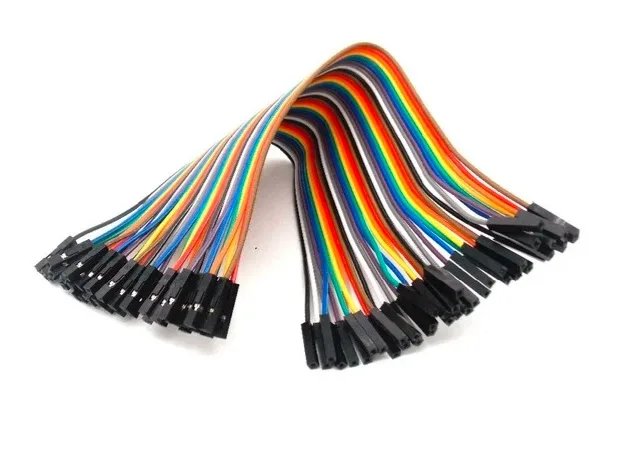
10CM Female To Female Breadboard Jumper Wires – 40Pcs
Essential jumper wires for connecting your test circuit to oscilloscope probe ground clips during signal measurements on breadboard prototypes.
Triggering: Making Waveforms Stand Still
Triggering is the feature that separates a useful oscilloscope measurement from an unreadable blur. The trigger circuit watches the incoming signal continuously and starts the horizontal sweep (drawing the waveform from left to right) only when a specific condition is met. By always starting the sweep at the same point in the signal, successive sweeps overlay each other, creating a stable, “frozen” image.
Edge Trigger (The Default and Most Common)
Edge triggering starts the sweep when the signal crosses a voltage threshold (the trigger level) in a specific direction (rising or falling). To set the trigger:
- Set trigger source to the channel you are measuring (CH1 or CH2)
- Set trigger type to “Edge”
- Set trigger slope to “Rising” (↑) for a rising edge trigger
- Set trigger level to approximately 50% of the signal amplitude
The oscilloscope will now start each sweep when the signal crosses the trigger level on a rising edge, giving you a stable display.
Auto vs Normal vs Single Trigger Modes
- Auto mode: The scope displays something even if no trigger event occurs — it free-runs. Good for initial setup when you just want to see a signal. Not good for one-shot or rare events.
- Normal mode: The scope only draws a waveform when a trigger event occurs. If no trigger is found, the screen freezes on the last captured waveform. This is the standard mode for capturing repetitive signals.
- Single mode: The scope waits for one trigger event, captures it, and then stops. This is essential for capturing one-time events like power-on transients, button press bouncing, or relay click spikes. Press Run/Stop to arm the trigger, then cause the event to capture it.
Common Waveforms and What They Tell You
Sine Wave
A smooth, curved oscillation. In electronics, sine waves indicate AC power (50Hz from the mains), audio signals, RF carrier signals, and the output of LC oscillators. A distorted sine wave (flattened top and bottom) indicates clipping, usually from an overdriven amplifier or power supply issue.
Square Wave
Sharp transitions between two voltage levels. Square waves indicate digital clock signals, PWM outputs, UART data lines, and digital logic outputs. On an oscilloscope, a perfect square wave has vertical rise and fall edges and flat tops and bottoms. Real square waves on an oscilloscope show: ringing (overshoot/undershoot at transitions caused by trace inductance), slow rise times (caused by excessive capacitance or filter), and glitches (caused by logic race conditions).
PWM Waveform
A square wave with variable pulse width. PWM signals are ubiquitous in electronics — motor speed control, LED dimming, servo control, DAC output. On the scope, measure the period and pulse width to calculate duty cycle. Check for jitter (varying pulse width between cycles) which indicates timer or interrupt issues in the microcontroller.
Noisy or Jagged Waveform
A waveform with random variations superimposed on it. This is electrical noise — from switching power supplies coupling into sensitive analog lines, from inadequate decoupling capacitors, from ground loops, or from insufficient PCB layout. The oscilloscope shows you exactly where and when the noise appears, helping you track down the source.

100nF Multilayer Ceramic Capacitor (Pack of 50)
When your oscilloscope reveals power supply noise on signal lines, the fix is usually 100nF decoupling capacitors placed close to the power pins of each IC. Stock up on these essential components.
Practical Measurements for Indian Makers
Measuring Arduino PWM Output
The Arduino Uno’s `analogWrite()` generates a 490Hz PWM signal on most pins (980Hz on pins 5 and 6). To observe it:
- Connect the probe tip to the PWM pin and ground clip to Arduino GND
- Set Volts/Div to 1V, Time/Div to 0.5ms (1ms for 490Hz signal)
- Trigger on rising edge, level ~2.5V
- You should see a square wave. At `analogWrite(127)`, the duty cycle should be approximately 50%
Checking a Power Supply for Ripple
Every DC power supply (including SMPS) has some AC ripple superimposed on the DC output. To measure it:
- Set the oscilloscope to AC coupling (removes the DC component)
- Connect the probe across the power supply output
- Set Volts/Div to 50mV or 100mV, Time/Div to 2ms (to see 50Hz ripple from a linear supply) or 10µs (for 50kHz switching ripple from SMPS)
- A good power supply should show less than 50mV ripple. More than 100mV indicates a failing electrolytic capacitor or inadequate filtering
Viewing I2C Communication
For debugging I2C communication between a microcontroller and a sensor (like DHT11 or OLED displays):
- Connect CH1 to SDA, CH2 to SCL
- Set both channels to 1V/div
- Set Time/Div to 50µs (for 100kHz I2C) or 10µs (for 400kHz fast mode)
- Trigger on CH2 (SCL) rising edge
- You can read the bit-by-bit data and verify the address and register bytes visually
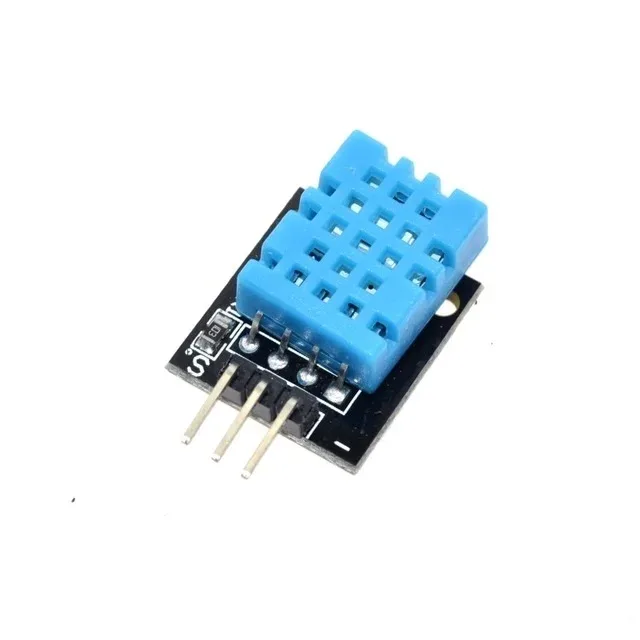
DHT11 Digital Humidity and Temperature Sensor Module
The DHT11 uses a single-wire protocol that you can observe and decode on your oscilloscope — a perfect beginner exercise in reading digital communication waveforms.
Frequently Asked Questions
What bandwidth oscilloscope do I need for Arduino and basic electronics work?
For Arduino, sensor interfaces, audio circuits, and basic power electronics at 5–24V, a 50–100MHz bandwidth DSO is more than adequate. The fastest signals you will encounter are Arduino’s 16MHz clock and 490Hz–980Hz PWM. A 50MHz scope can capture signals up to 50MHz without distortion. Budget models like the Hantek DSO5072P (70MHz) or DS1054Z (50MHz upgradeable to 100MHz) are excellent choices for Indian hobbyists and cost ₹6,000–₹15,000.
My waveform is constantly moving / rolling and won’t stay still. How do I fix it?
This is a trigger issue. Your trigger level is likely set incorrectly — either too high or too low for the signal. Try pressing the “Auto” button (most scopes have one) which automatically sets voltage, time, and trigger for the detected signal. If the problem persists, manually set the trigger level to 50% of the signal amplitude. Also check that the trigger source is set to the correct channel.
Why does my oscilloscope show a flat line even though I have a signal?
Possible causes: (1) Volts/Div is set too high — reduce it until the signal is visible. (2) The signal’s frequency is much faster than your Time/Div — set Time/Div to a much faster value. (3) The channel is in DC coupling and the DC offset is pushing the waveform off screen — adjust vertical position. (4) Probe is in 10× mode but scope is set to 1× attenuation — the signal appears 10× smaller. Tell the scope the probe ratio.
Can I use an oscilloscope to measure mains 230V AC?
Technically yes, but it requires proper safety precautions and a differential probe or isolation transformer. Never directly connect a standard oscilloscope probe to mains voltage — the probe’s ground clip is connected to earth through the oscilloscope, and connecting it to the live terminal will short mains to earth, blow fuses, trip breakers, and potentially electrocute you. Use a differential high-voltage probe (rated for mains measurement), or measure indirectly through a current transformer or a mains-isolated measurement system.
What is the difference between bandwidth and sample rate in an oscilloscope?
Bandwidth is the highest frequency the oscilloscope can accurately display (the -3dB point where the amplitude is attenuated to 70.7% of the actual value). Sample rate is how many times per second the ADC inside the scope captures a sample (in Megasamples/second or Gigasamples/second). The Nyquist theorem says you need at least 2× samples per cycle to reconstruct a waveform. For accurate representation, you actually need 5–10× oversampling. A 100MHz bandwidth scope needs at least 1 GSa/s sample rate. Many budget scopes have high headline sample rates but only achieve them on one channel — check the per-channel sample rate, not the maximum total rate.
Build Circuits Worth Measuring
Now that you can read an oscilloscope, you need circuits to test! Explore Zbotic’s wide range of sensors, microcontroller modules, power components, and prototyping accessories. Everything you need to build and debug interesting electronics projects — at great prices for Indian makers.


Add comment