
Indoor air quality is a growing concern across India, especially in cities like Delhi, Mumbai, and Bengaluru where pollution levels are high. Building your own IoT air quality monitor with the SCD40 sensor gives you accurate CO2 and temperature/humidity readings that you can track in real time on your phone or a web dashboard. In this project guide, we will walk through the SCD40 sensor, explain what TVOC and CO2 measurements mean for health, and provide complete working code for an ESP32-based air quality monitor.
Why Monitor Indoor Air Quality in India?
Most people assume that staying indoors protects them from air pollution. The reality is more alarming: the WHO estimates that indoor air can be 2–5 times more polluted than outdoor air. In Indian homes, common sources of indoor pollution include cooking smoke, incense sticks, mosquito coils, synthetic furnishings releasing VOCs, and poor ventilation.
High CO2 levels (above 1000 ppm) cause drowsiness, reduced concentration, and headaches — a serious problem in offices, classrooms, and bedrooms across India. TVOC (Total Volatile Organic Compounds) from paints, cleaning products, and furniture can cause respiratory irritation and long-term health issues.
An IoT air quality monitor lets you:
- Track CO2 levels in real time and get alerts when ventilation is needed
- Monitor VOC spikes after painting, cleaning, or using chemical products
- Log historical trends to understand your home’s air quality patterns
- Make data-driven decisions about air purifiers and ventilation
SCD40 Sensor: CO2, Temperature, and Humidity
The Sensirion SCD40 is a photoacoustic CO2 sensor that also measures temperature and relative humidity. Unlike the cheaper MQ-135 gas sensor, the SCD40 uses a true NDIR (Non-Dispersive Infrared) measurement method for CO2, giving it much better accuracy and long-term stability.
SCD40 key specifications:
- CO2 range: 400–2000 ppm (±50 ppm + 5% of reading)
- Temperature: -10°C to 60°C (±0.2°C)
- Humidity: 0–100% RH (±6% RH)
- Interface: I2C (address 0x62, fixed)
- Power: 3.3V, ~18 mA during measurement
- Measurement interval: 5 seconds (continuous), 30+ seconds (low power)
The SCD40 requires 30 seconds to 3 minutes of warm-up time before readings stabilise. For highly accurate CO2 readings, Sensirion recommends allowing 20–30 minutes of operation in the target environment, as the sensor performs automatic self-calibration (ASC) when exposed to fresh outdoor air (400 ppm baseline) at least once a week.
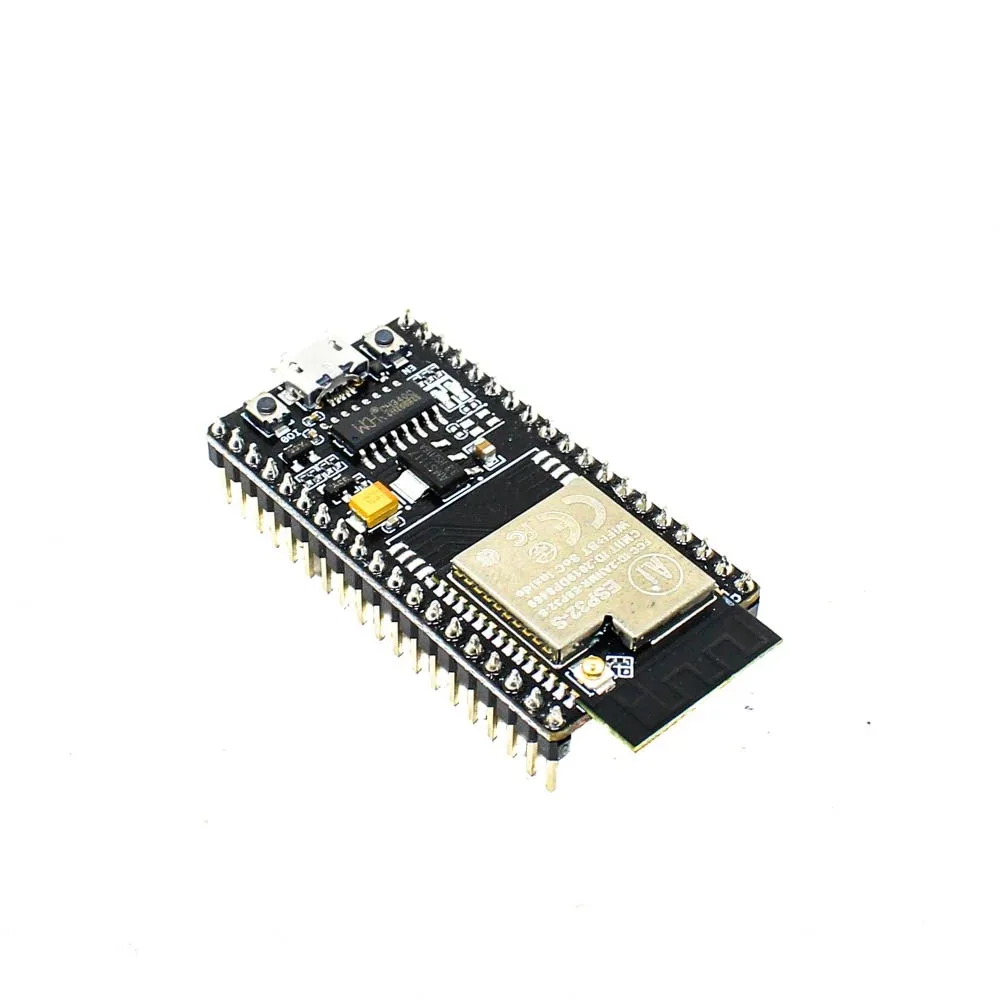
Ai Thinker NodeMCU-32S ESP32 Development Board – IPEX Version
The ideal ESP32 board for your IoT air quality monitor — dual core, Wi-Fi built in, and enough GPIO for sensors plus a display.
Understanding TVOC: What It Means and Why It Matters
TVOC stands for Total Volatile Organic Compounds — a collective measure of all gaseous organic chemicals present in the air. These come from hundreds of sources in a typical Indian home or office: fresh paint, carpets, furniture, air fresheners, cleaning agents, photocopiers, and even some foods during cooking.
TVOC level guidelines (WHO and IAQ standards):
| TVOC Level (μg/m³) | Air Quality Category | Health Impact |
|---|---|---|
| 0–220 | Excellent | No issues |
| 220–660 | Good | Sensitive individuals may notice |
| 660–2200 | Moderate | Discomfort, increase ventilation |
| 2200–5500 | Poor | Headaches, irritation, open windows immediately |
| 5500+ | Hazardous | Leave area, serious health risk |
The SCD40 does not directly measure TVOC. For true TVOC measurement, you need to pair the SCD40 with a separate TVOC/VOC sensor such as the SGP30 or ENS160. Many makers use the BME680 from Bosch which provides an air quality index that includes VOC contribution. In this guide, we will use the SCD40 for accurate CO2 plus temperature and humidity, and mention how to extend the system with a TVOC sensor.
Hardware Setup and Wiring
The SCD40 communicates over I2C, making wiring extremely simple. Here is what you need and how to connect it:
Components list:
- ESP32 development board
- SCD40 CO2 sensor module (breakout board)
- 0.96″ or 1.3″ OLED display (optional, for standalone display)
- Breadboard and jumper wires
- USB power bank or battery shield for portable operation
SCD40 to ESP32 wiring (I2C):
- SCD40 VDD → ESP32 3.3V
- SCD40 GND → ESP32 GND
- SCD40 SDA → ESP32 GPIO21 (default I2C SDA)
- SCD40 SCL → ESP32 GPIO22 (default I2C SCL)
If adding an OLED display (also I2C), connect it to the same SDA/SCL lines. I2C is a bus protocol and supports multiple devices — just make sure they have different addresses. The SCD40 uses 0x62 and most OLED displays use 0x3C or 0x3D.
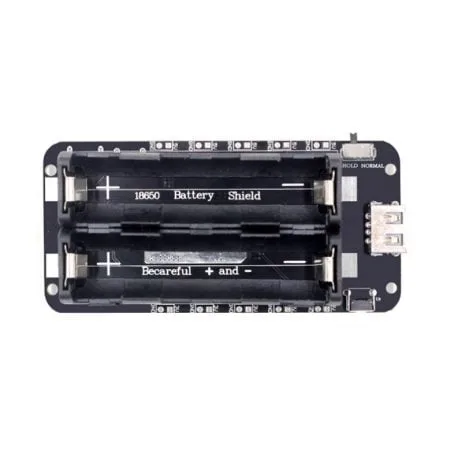
2 x 18650 Lithium Battery Shield V8 for ESP32 – 5V/3A
Power your portable air quality monitor for hours with this dual 18650 battery shield — provides clean 5V output for stable sensor readings.
Arduino Code for ESP32 + SCD40
Install the following libraries from Arduino Library Manager:
- Sensirion I2C SCD4x by Sensirion
- Adafruit SSD1306 (if using OLED display)
- WiFi (built into ESP32 board package)
#include <Arduino.h>
#include <Wire.h>
#include <SensirionI2CScd4x.h>
#include <WiFi.h>
#include <WebServer.h>
const char* ssid = "YourWiFiSSID";
const char* password = "YourWiFiPassword";
SensirionI2CScd4x scd4x;
WebServer server(80);
uint16_t co2 = 0;
float temperature = 0.0f;
float humidity = 0.0f;
bool dataValid = false;
// Serve a simple HTML dashboard
void handleRoot() {
String quality = "Good";
String colour = "green";
if (co2 > 2000) { quality = "Hazardous"; colour = "red"; }
else if (co2 > 1500) { quality = "Poor"; colour = "orange"; }
else if (co2 > 1000) { quality = "Moderate"; colour = "#e6b800"; }
String html = "<!DOCTYPE html><html><head><meta charset='utf-8'>";
html += "<meta http-equiv='refresh' content='10'>";
html += "<title>Air Quality Monitor</title>";
html += "<style>body{font-family:sans-serif;max-width:400px;margin:40px auto;padding:20px;text-align:center}";
html += ".val{font-size:3em;font-weight:bold}.label{color:#666;font-size:0.9em}</style></head><body>";
html += "<h1>Air Quality Monitor</h1>";
html += "<p style='color:" + colour + ";font-size:1.5em'>" + quality + "</p>";
html += "<div class='val' style='color:" + colour + "'>" + String(co2) + " ppm</div>";
html += "<div class='label'>CO2 Concentration</div><br>";
html += "<div class='val'>" + String(temperature, 1) + " °C</div>";
html += "<div class='label'>Temperature</div><br>";
html += "<div class='val'>" + String(humidity, 1) + " %</div>";
html += "<div class='label'>Relative Humidity</div>";
html += "<p style='font-size:0.8em;color:#999'>Auto-refreshes every 10s</p>";
html += "</body></html>";
server.send(200, "text/html", html);
}
void setup() {
Serial.begin(115200);
Wire.begin();
// Connect to Wi-Fi
WiFi.begin(ssid, password);
while (WiFi.status() != WL_CONNECTED) {
delay(500);
Serial.print(".");
}
Serial.println("nWi-Fi connected! IP: " + WiFi.localIP().toString());
// Start SCD40
scd4x.begin(Wire);
uint16_t error = scd4x.startPeriodicMeasurement();
if (error) {
Serial.println("SCD40 start error!");
} else {
Serial.println("SCD40 started OK");
}
// Start web server
server.on("/", handleRoot);
server.begin();
Serial.println("Web server started");
}
void loop() {
server.handleClient();
// Check SCD40 every 5 seconds
static unsigned long lastRead = 0;
if (millis() - lastRead > 5000) {
lastRead = millis();
bool isDataReady = false;
scd4x.getDataReadyFlag(isDataReady);
if (isDataReady) {
scd4x.readMeasurement(co2, temperature, humidity);
dataValid = true;
Serial.printf("CO2: %u ppm | Temp: %.1f C | Humi: %.1f%%n",
co2, temperature, humidity);
}
}
}After uploading, open the Serial Monitor to get the ESP32’s IP address, then open that IP in your browser to see the live air quality dashboard.
Displaying Data: OLED, Web Dashboard, and Mobile App
There are three popular ways to display your air quality data:
Option 1: OLED Display (Standalone)
Add a 0.96″ I2C OLED display for a self-contained air quality meter. Use the Adafruit SSD1306 library to display CO2, temperature, and humidity with a simple bar graph for CO2 levels. The OLED consumes very little power and works without Wi-Fi.
Option 2: Web Dashboard (Built-in)
The code above includes a built-in web server that creates a colour-coded dashboard. Open http://[ESP32-IP-address] on any device connected to your home Wi-Fi to see live readings. No app or internet required.
Option 3: MQTT + Home Assistant
For advanced users, publish readings to an MQTT broker and integrate with Home Assistant. This gives you historical graphs, automations (e.g., turn on exhaust fan when CO2 exceeds 1000 ppm), and smartphone notifications. Use the PubSubClient library for MQTT on ESP32.

Waveshare ESP32-S3 1.47inch 172×320 LCD Display Development Board
Display your air quality readings beautifully on a colour LCD — great for building a premium-looking air quality monitor with visual alerts.
Interpreting Your Readings and Taking Action
Once your monitor is running, here is how to interpret the CO2 readings:
- 400–600 ppm: Fresh air, excellent. Typically achieved with windows open or in well-ventilated spaces.
- 600–1000 ppm: Normal indoor air with some occupants. No action needed.
- 1000–1500 ppm: Getting stuffy. Open a window or switch on ventilation. Concentration and focus begin declining.
- 1500–2000 ppm: Noticeably poor air quality. Headaches and drowsiness are common. Ventilate immediately.
- 2000+ ppm: Seriously elevated. In poorly ventilated Indian office meeting rooms with many people, this is not uncommon. Open all windows and turn on fans.
Common findings in Indian homes:
- Sleeping with bedroom doors and windows closed overnight can push CO2 above 1500 ppm by morning
- Cooking with gas stoves briefly spikes CO2 to 2000–4000 ppm — always use kitchen exhaust
- Air conditioning recirculation mode without fresh air intake raises CO2 continuously
- Newly painted rooms or rooms with new furniture show high TVOC for weeks
Frequently Asked Questions
Is the SCD40 better than the MQ-135 for CO2 measurement?
Yes, significantly. The MQ-135 is a metal oxide semiconductor sensor that measures general gas concentration and estimates CO2 indirectly. It requires calibration in clean air, drifts significantly over time, and is sensitive to temperature and humidity changes. The SCD40 uses true photoacoustic CO2 sensing, is pre-calibrated at the factory, and provides accurate readings within its specified range. For any serious air quality monitoring, the SCD40 is the right choice.
How often does the SCD40 need calibration?
The SCD40 has automatic self-calibration (ASC) that runs in the background. It assumes the sensor sees outdoor-level CO2 (400 ppm) at least once every 7 days. If your device is always in an enclosed space, disable ASC and perform forced recalibration periodically by placing the sensor outdoors in fresh air. The Sensirion library provides performForcedRecalibration() for this purpose.
Can I add a TVOC sensor to this project?
Yes. The SGP30 or ENS160 are popular I2C TVOC sensors that work alongside the SCD40 on the same I2C bus. The SGP30 provides both TVOC (in ppb) and eCO2 (estimated CO2). The ENS160 provides a more sophisticated AQI score. Both are available as breakout modules and use the same wiring approach as the SCD40.
Can this project run on battery power?
Yes. The SCD40 has a low-power single-shot mode that takes only one measurement every 5 minutes, dramatically reducing power consumption. In this mode, the ESP32 can deep sleep between measurements. A 18650 battery can power such a system for several days, making it ideal for portable room-by-room air quality checks.
What is the range of the built-in web server?
The web server is accessible from any device on the same Wi-Fi network. To access readings remotely (outside your home), you can push data to MQTT, Firebase, or any cloud platform. A simple approach is to use a free service like Adafruit IO or ThingSpeak to receive and display readings remotely.
Build Your Own Air Quality Monitor Today
Get ESP32 boards, sensors, battery shields, and all components for your IoT air quality project from Zbotic — India’s trusted electronics component store.


Add comment